

A group is told
by what it recorded.
This page was built from the group’s own photographic archive: files made between June 2017 and August 2025, inside the State University of Maringá. No image here was staged or computer-generated.
- 2017
- First record
- 500
- Files in the archive
- 9
- Years covered
- 36
- Images published
It starts in a classroom.
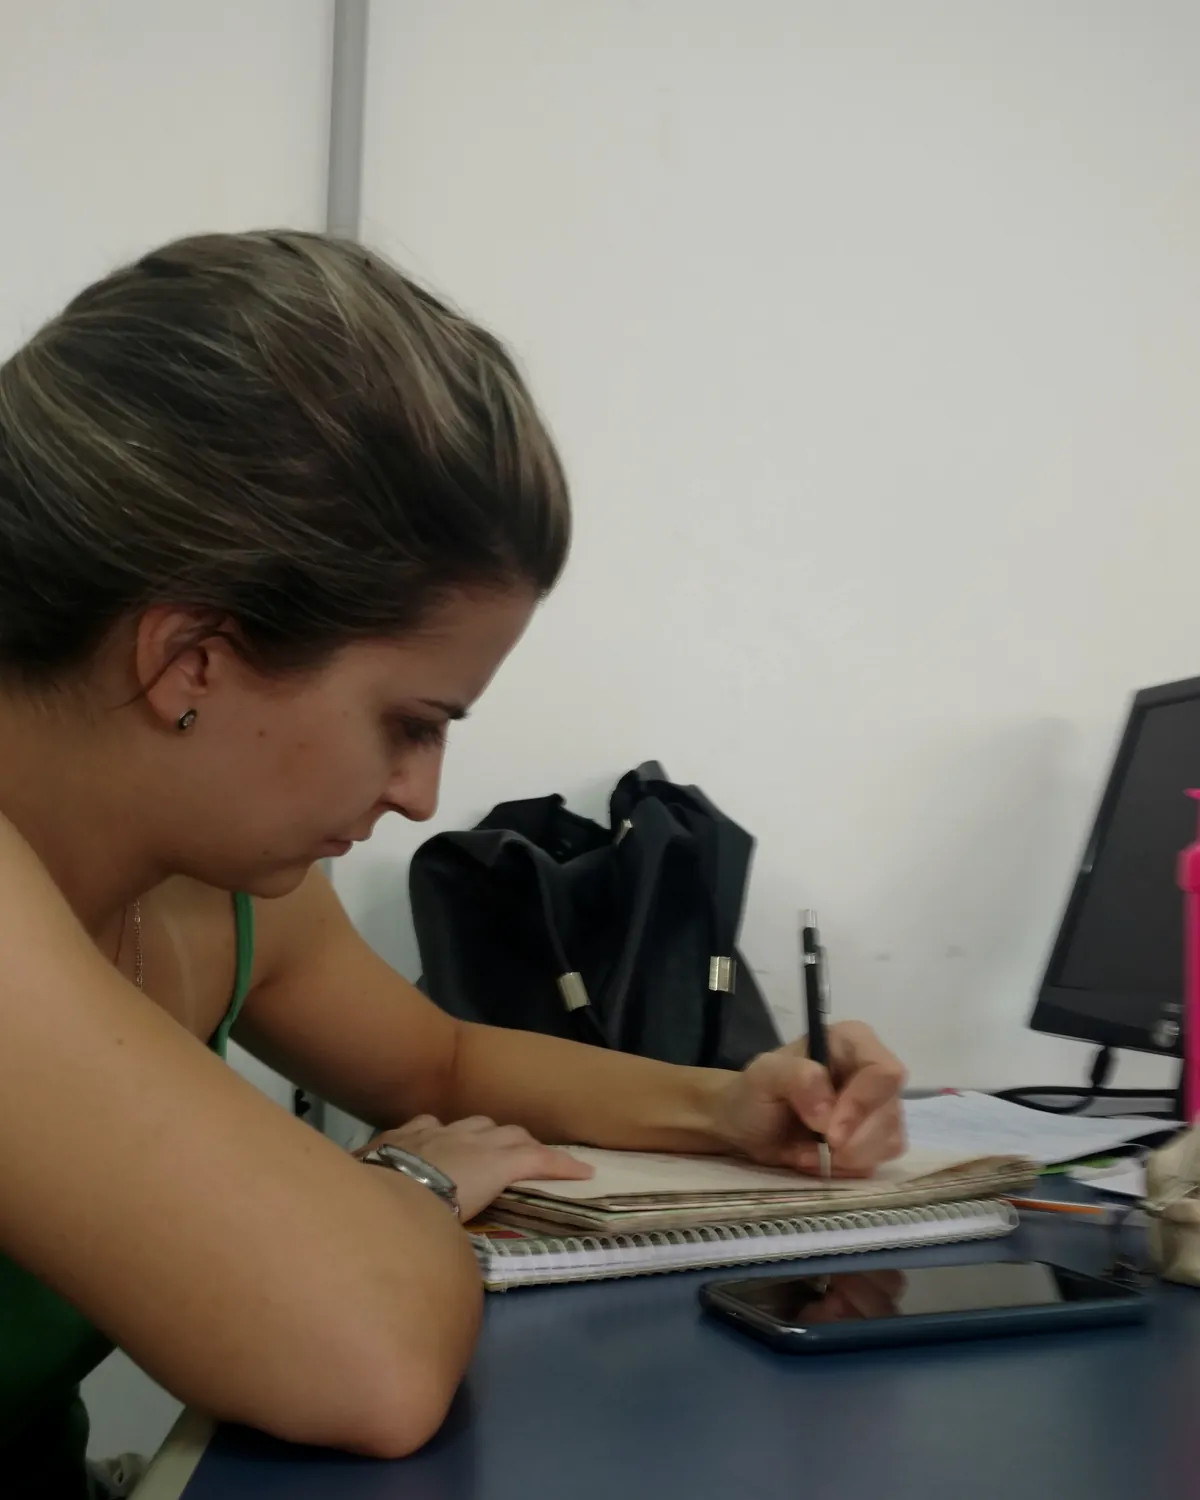
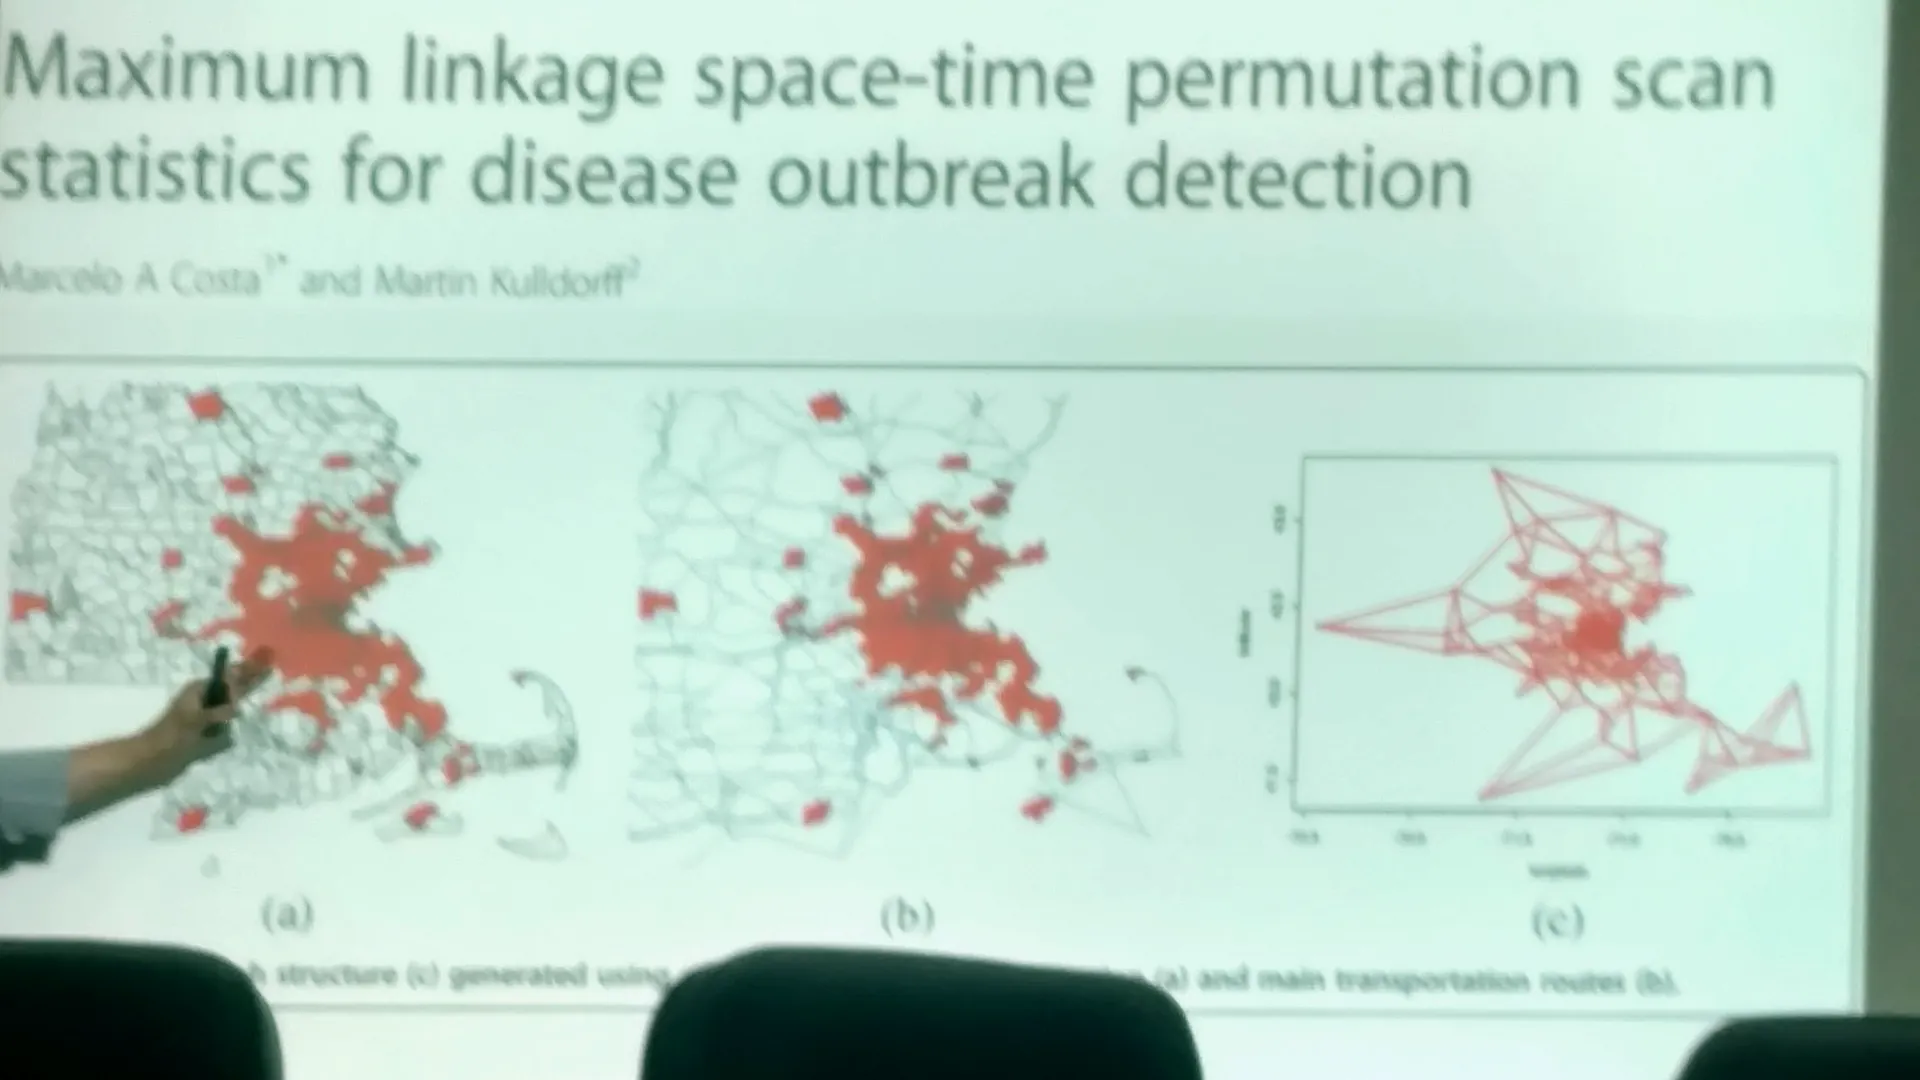
The oldest file in the archive is dated 14 June 2017: a room in the Health Sciences Centre, projector on, chairs taken. Over the following months what would become routine appears — someone writing beside a monitor, a seminar projecting an open-access paper on outbreak detection.
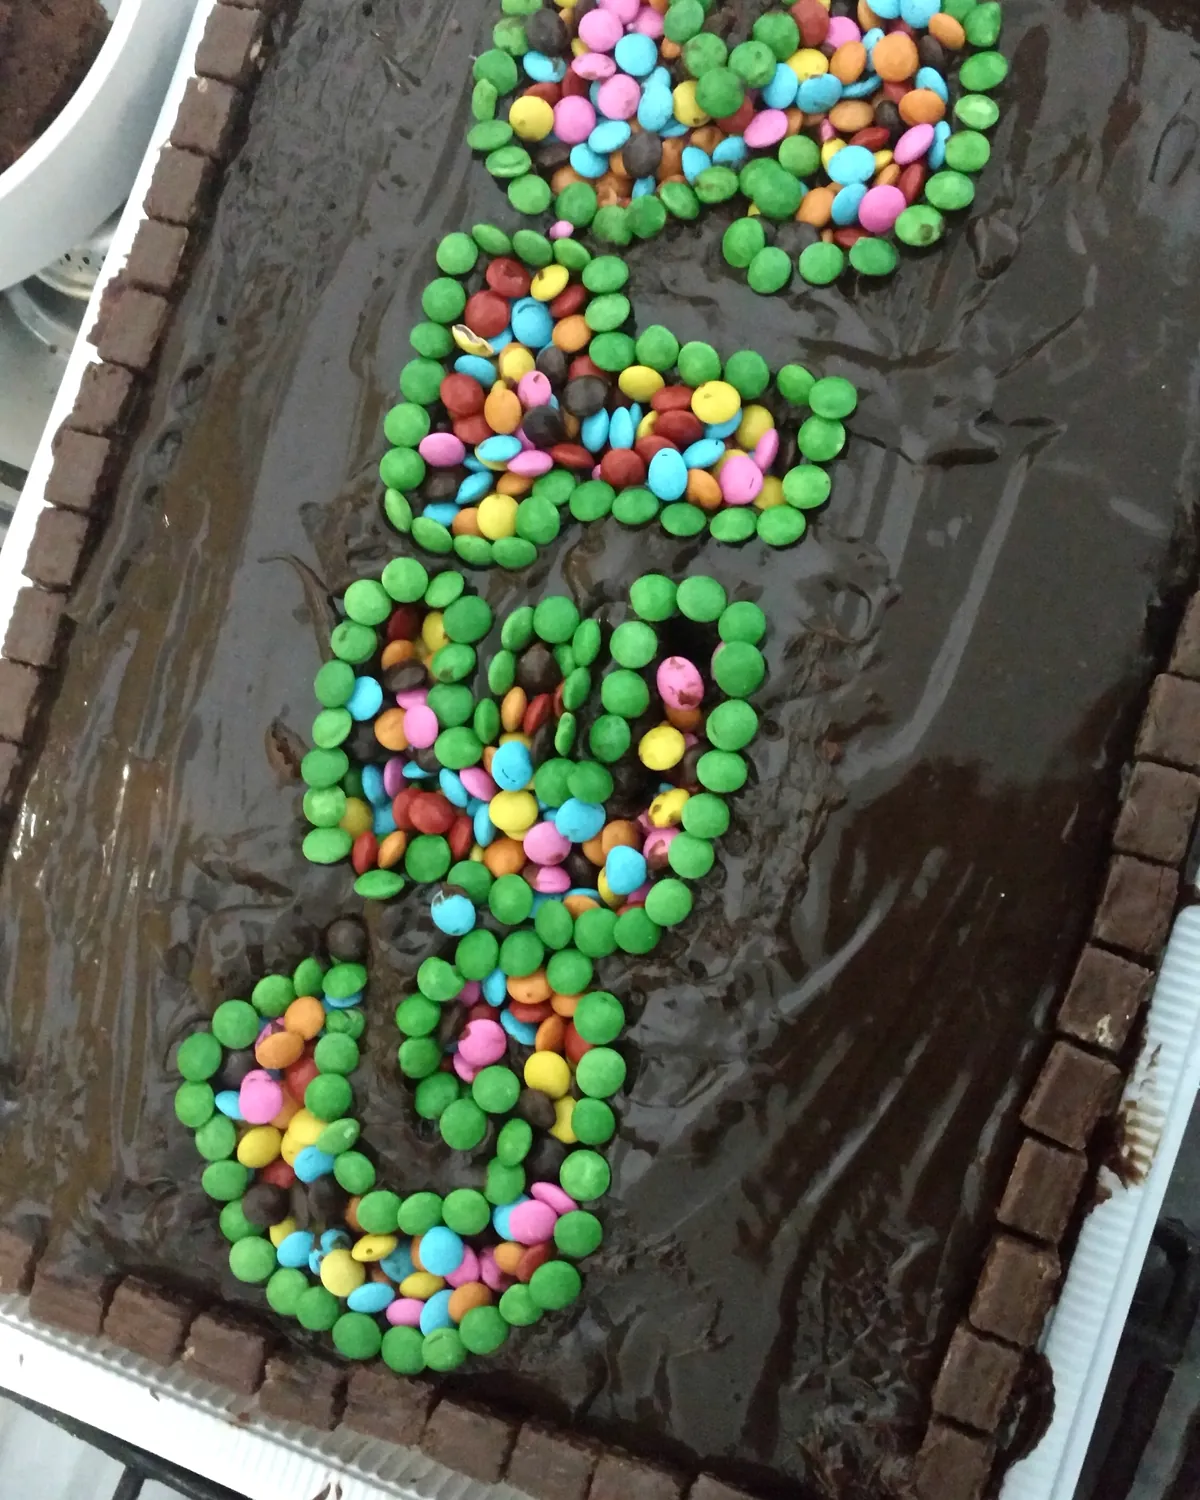
By December of that year the group’s initials had already been spelled out in candy on a cake. It is the first time the name shows up off a screen.
14.06.2017 — first file in the archive

Nine years, one at a time.
Each item below is a file from the archive, on the date it was made. The captions describe only what is in the picture.
- 20184 records
The most photographed year in the archive. The first items carrying the mark appear, along with the first density map on the lab screens and the whole team at a congress held by their own university.
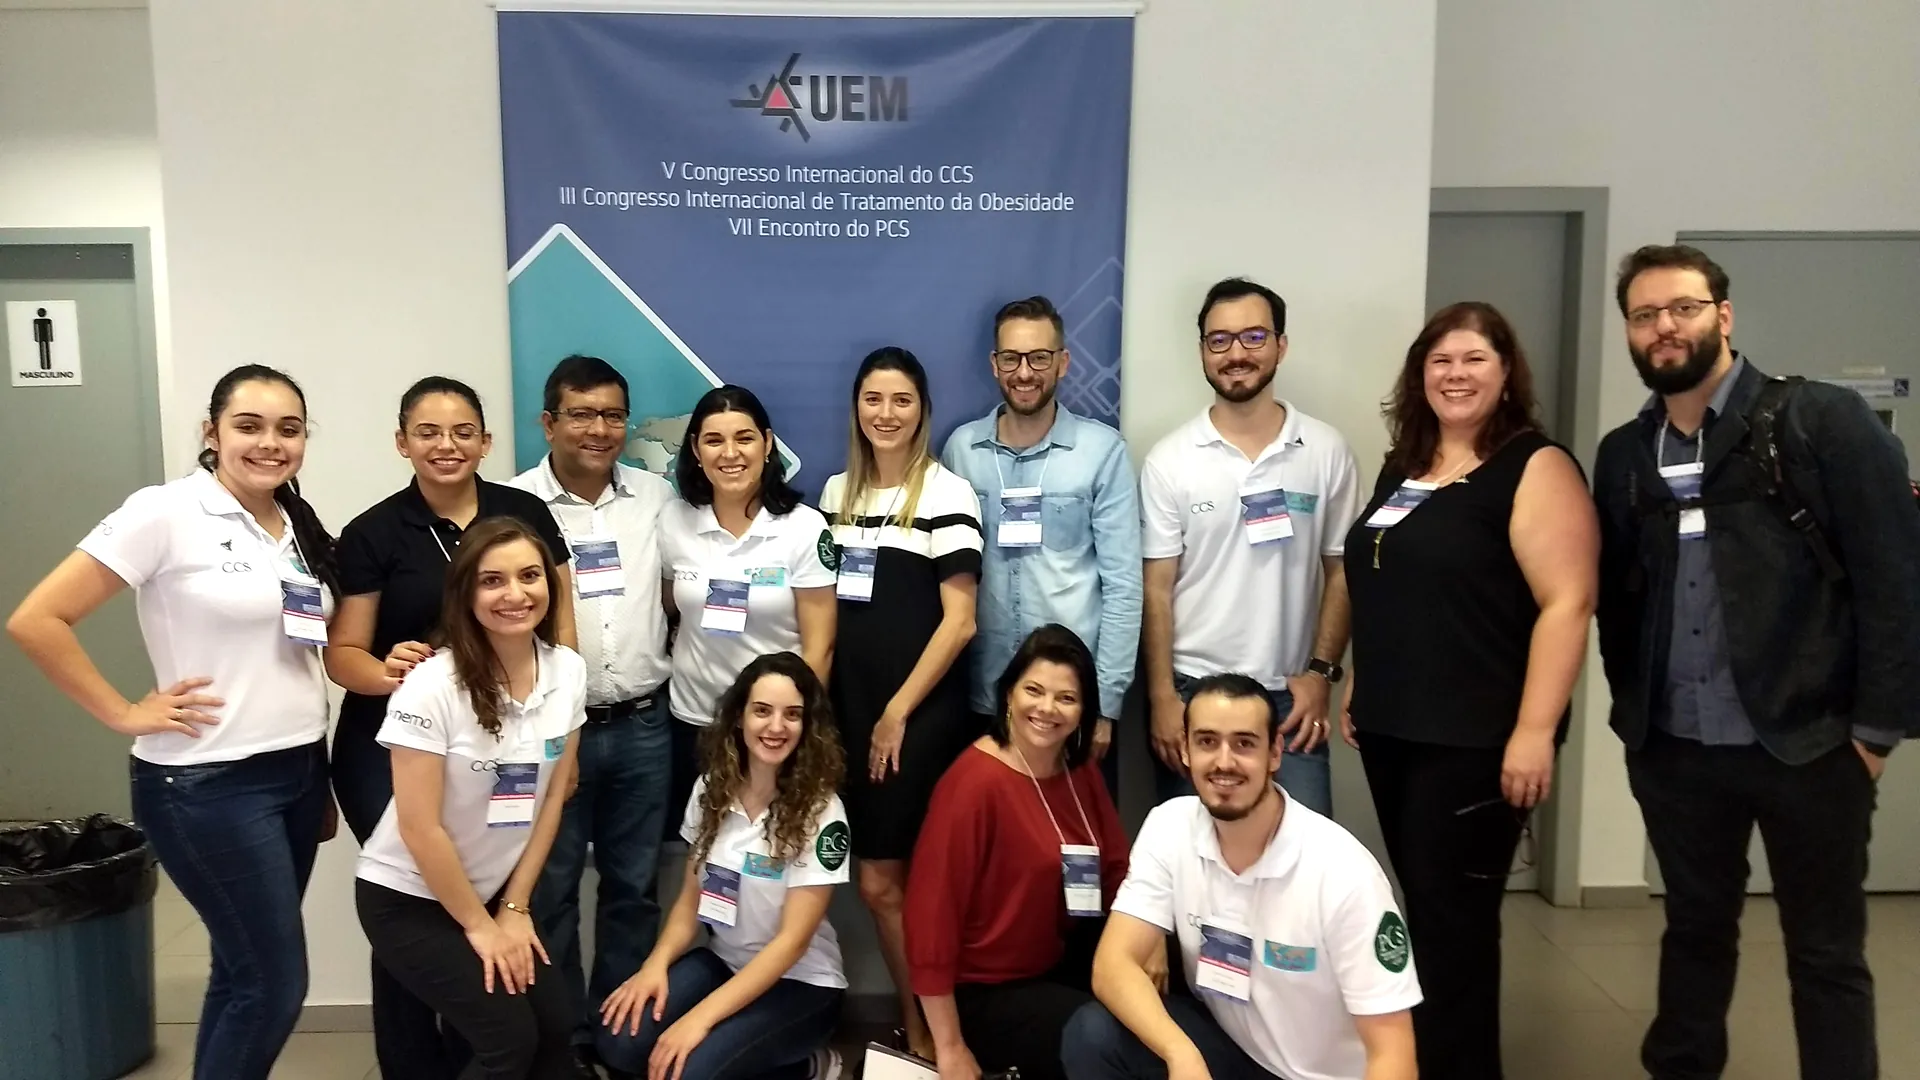
The team at the UEM Health Sciences Centre congress, October 2018. 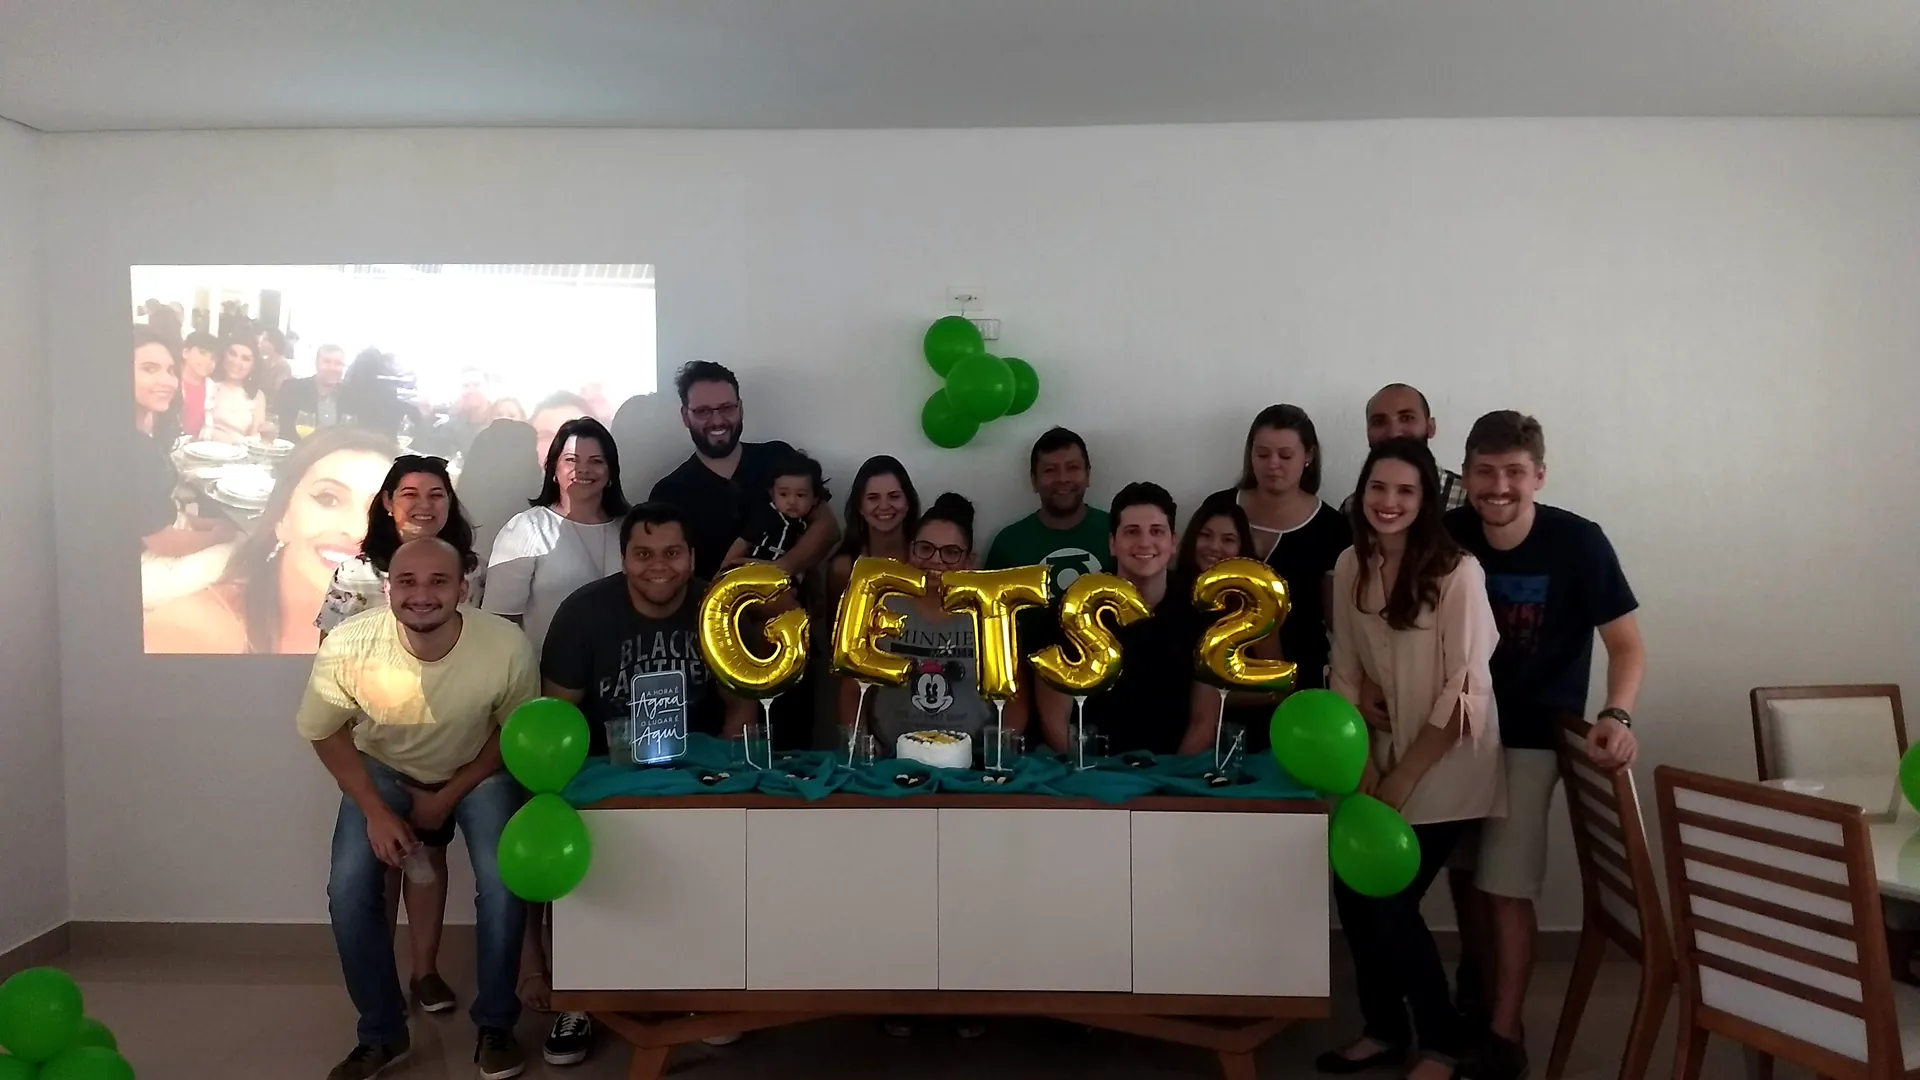
The group’s anniversary celebration, November 2018. 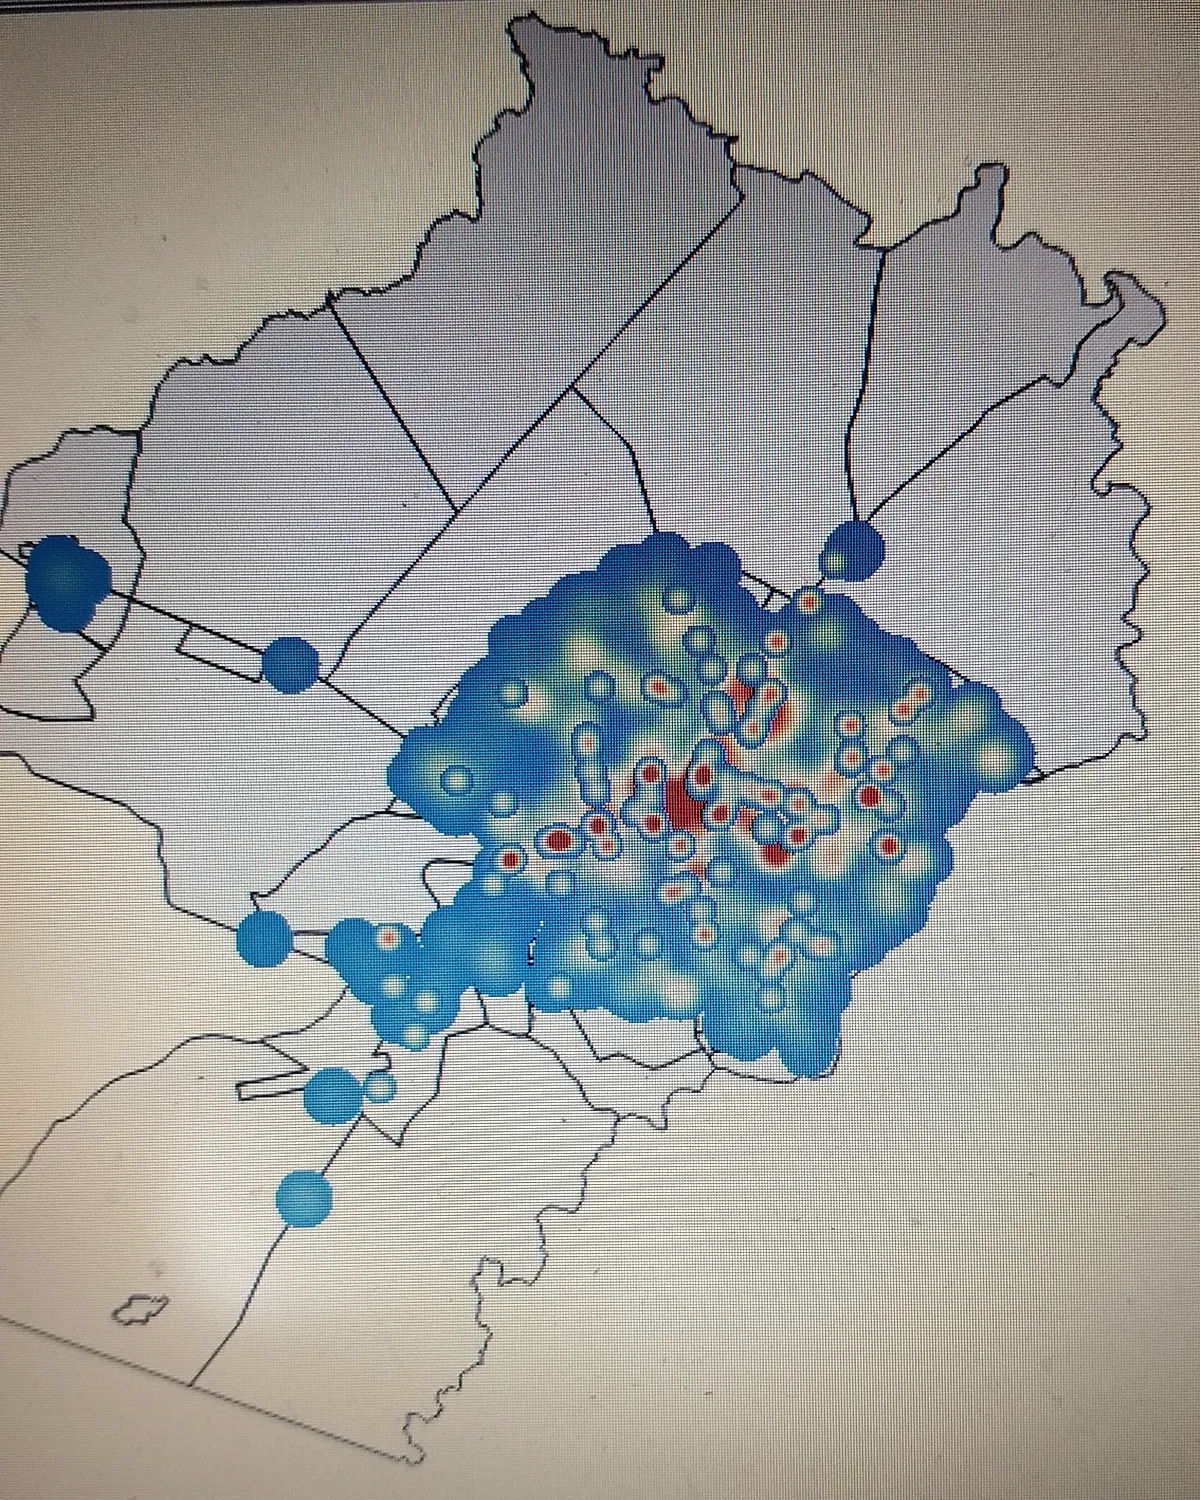
A density map in open-source GIS software, on a lab screen, August 2018. 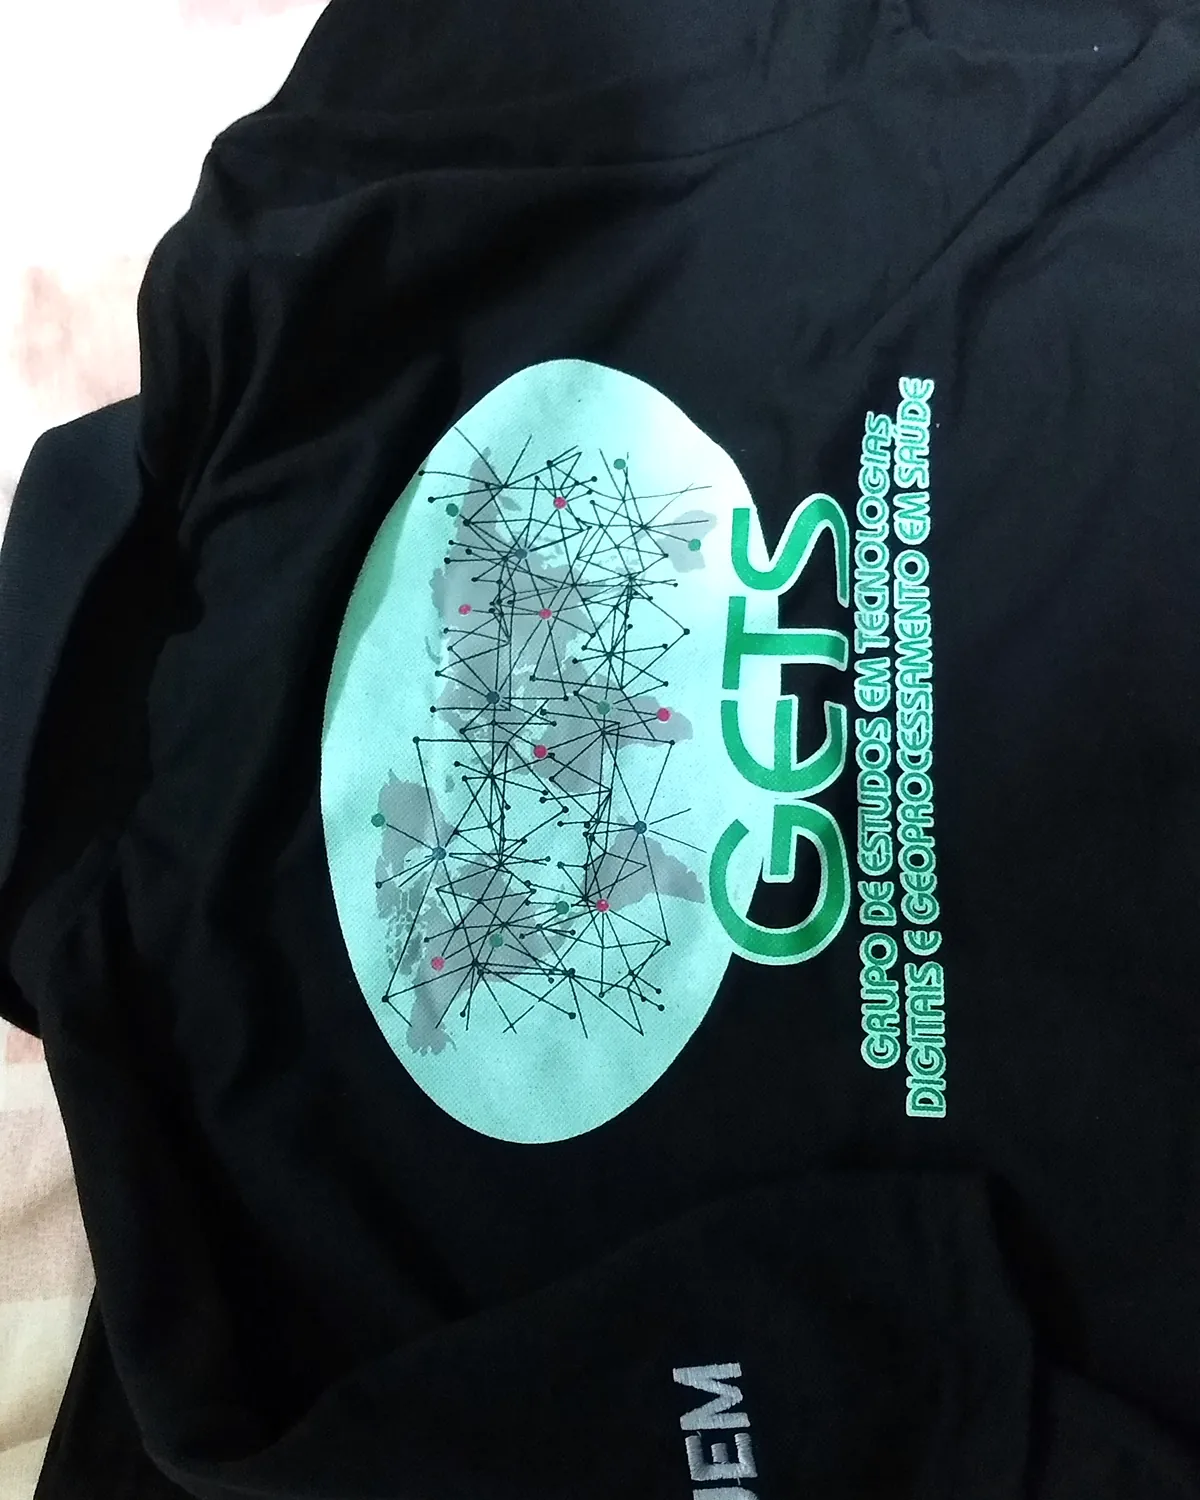
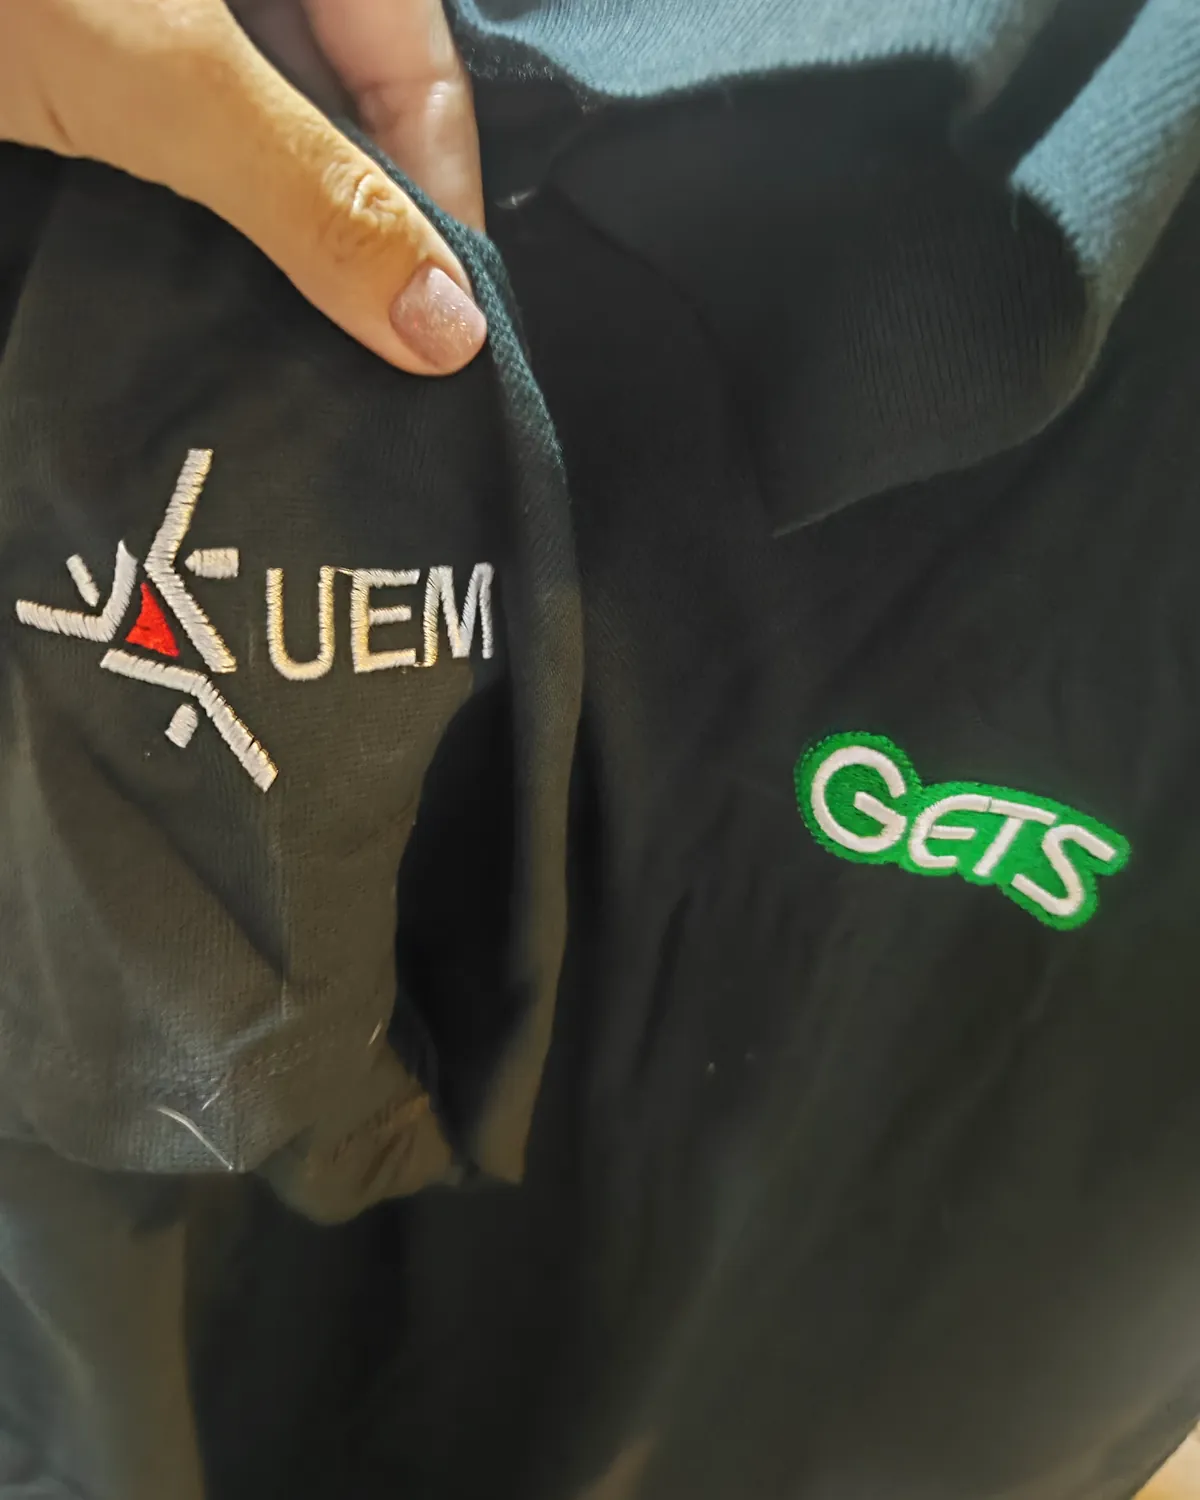
The oldest T-shirt in the archive, carrying the world map and the UEM signature, May 2018. - 20198 records
Full rooms. Defences, posters, courses and working meetings — the 2019 archive is almost entirely made of people gathered together.
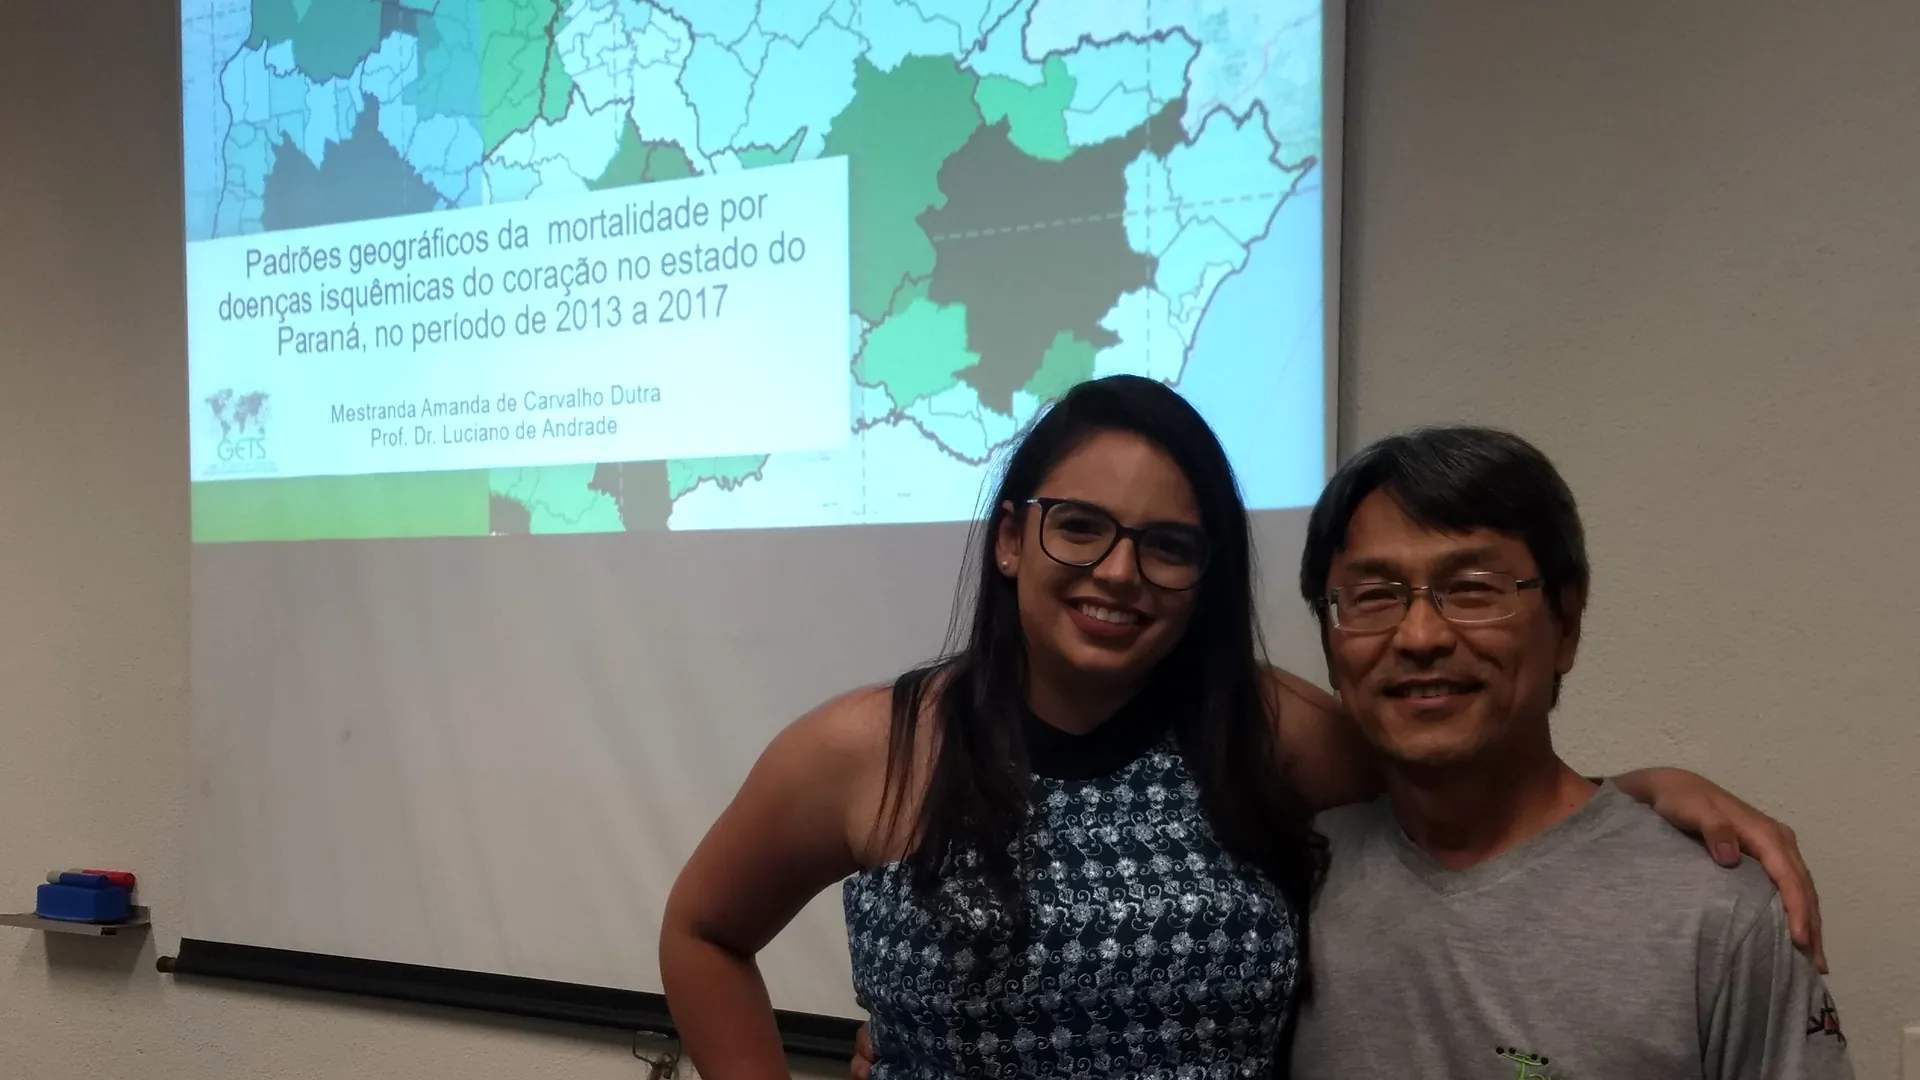
A thesis defence on geographic patterns of ischaemic heart disease mortality in Paraná, December 2019. 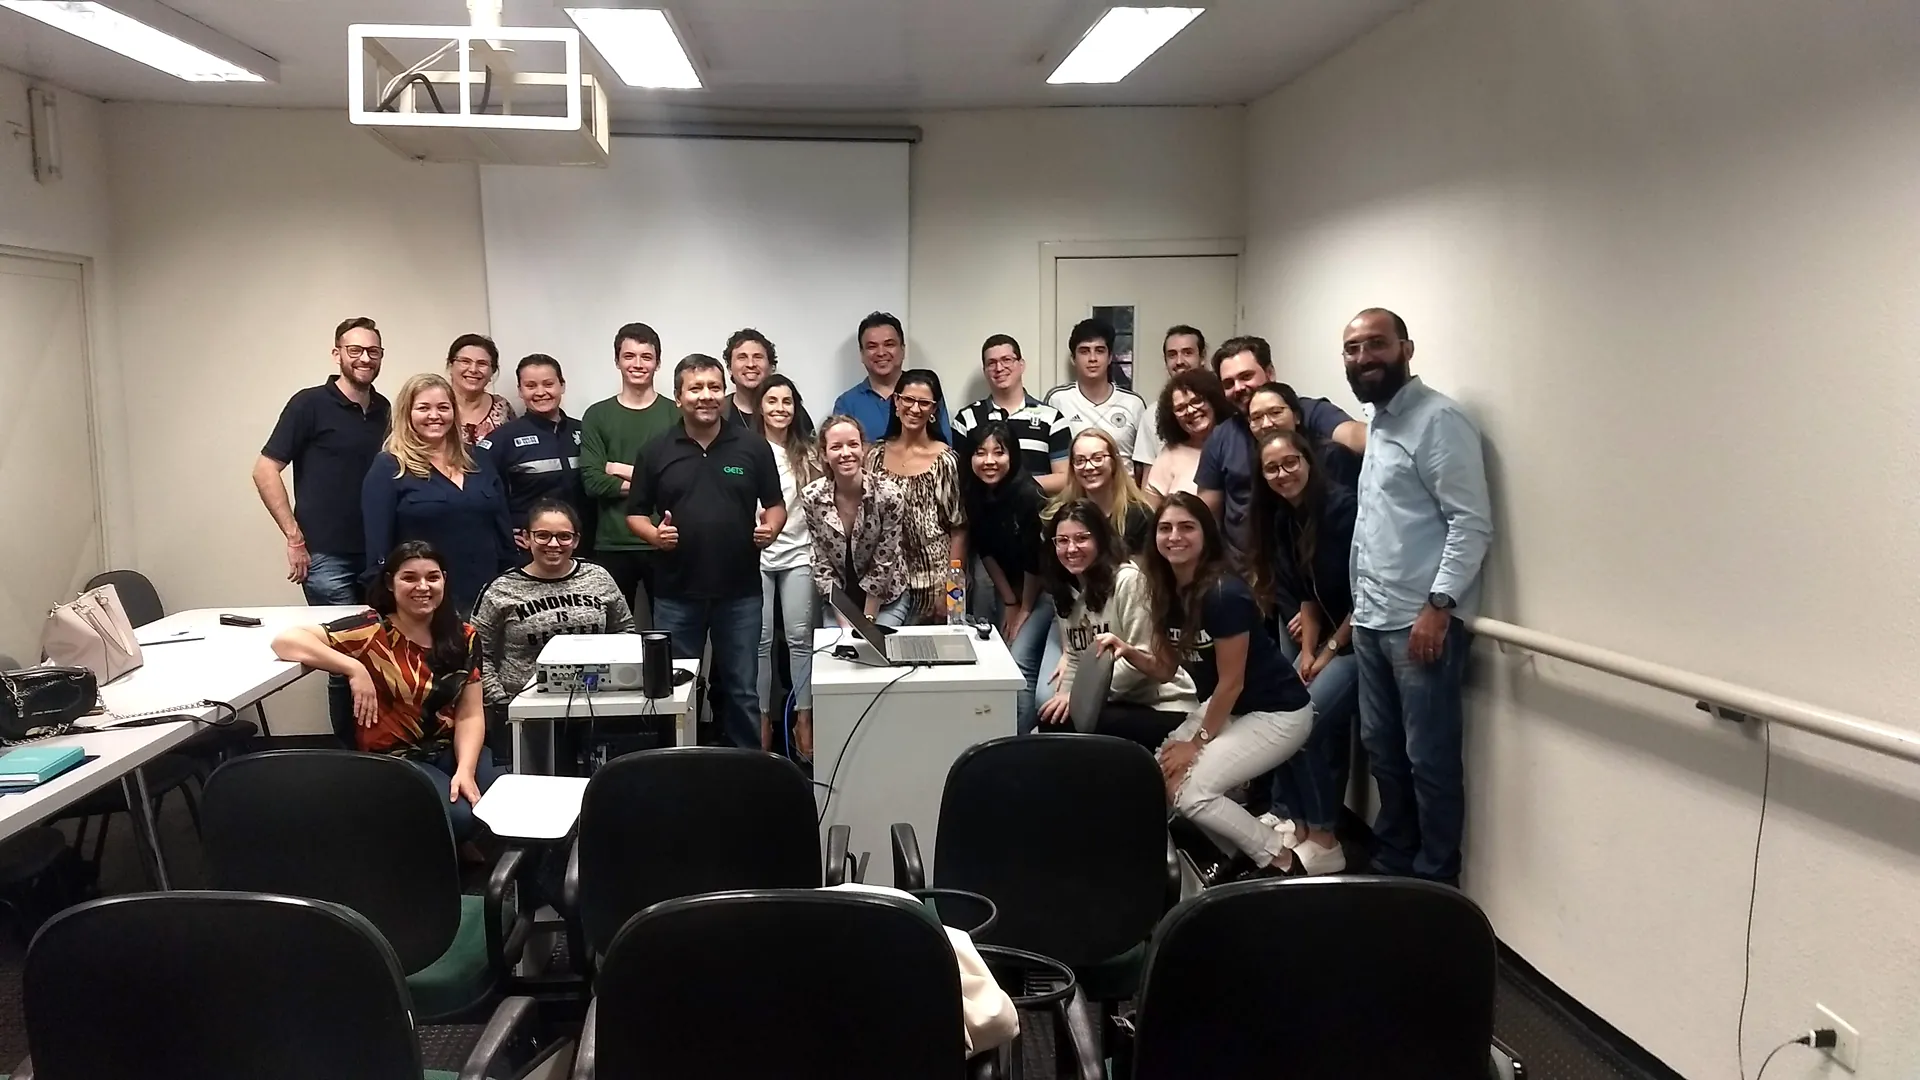
A class gathered at the end of a training session, August 2019. 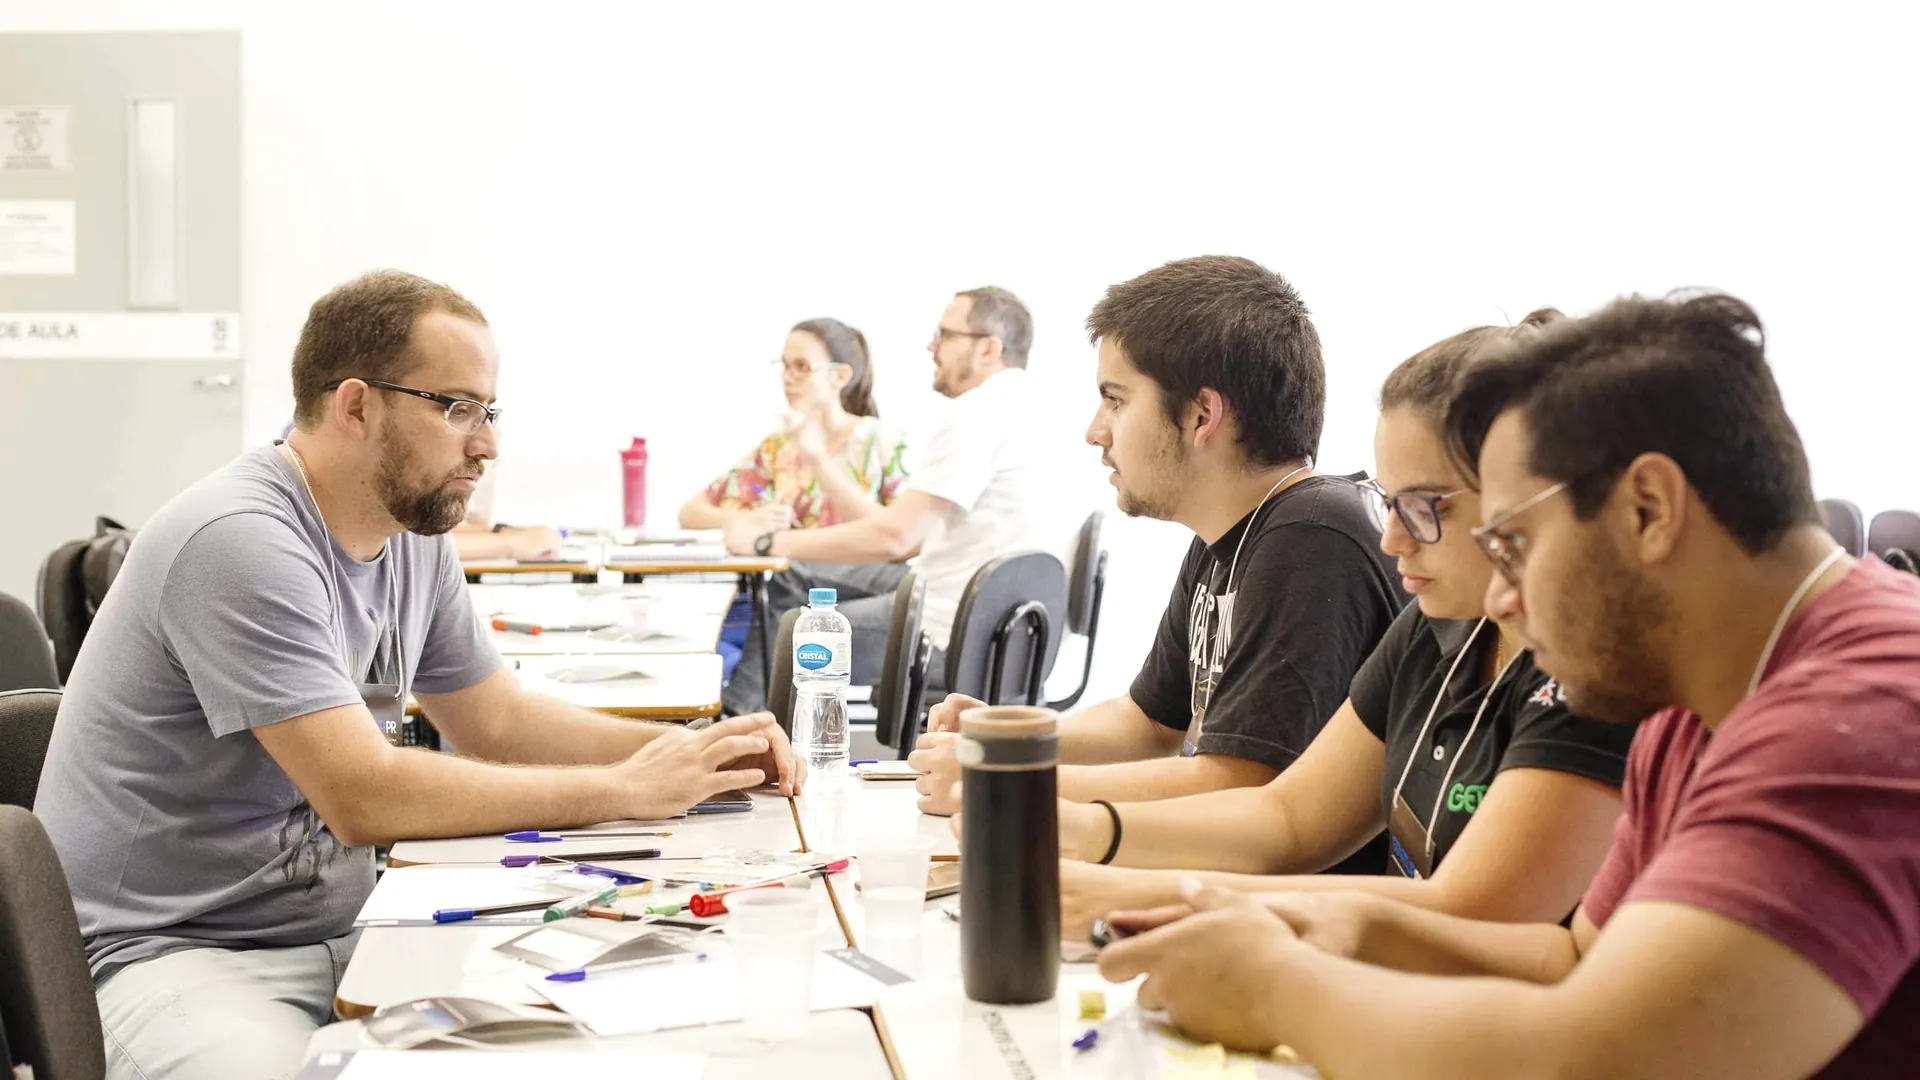
A working meeting of the group, November 2019. 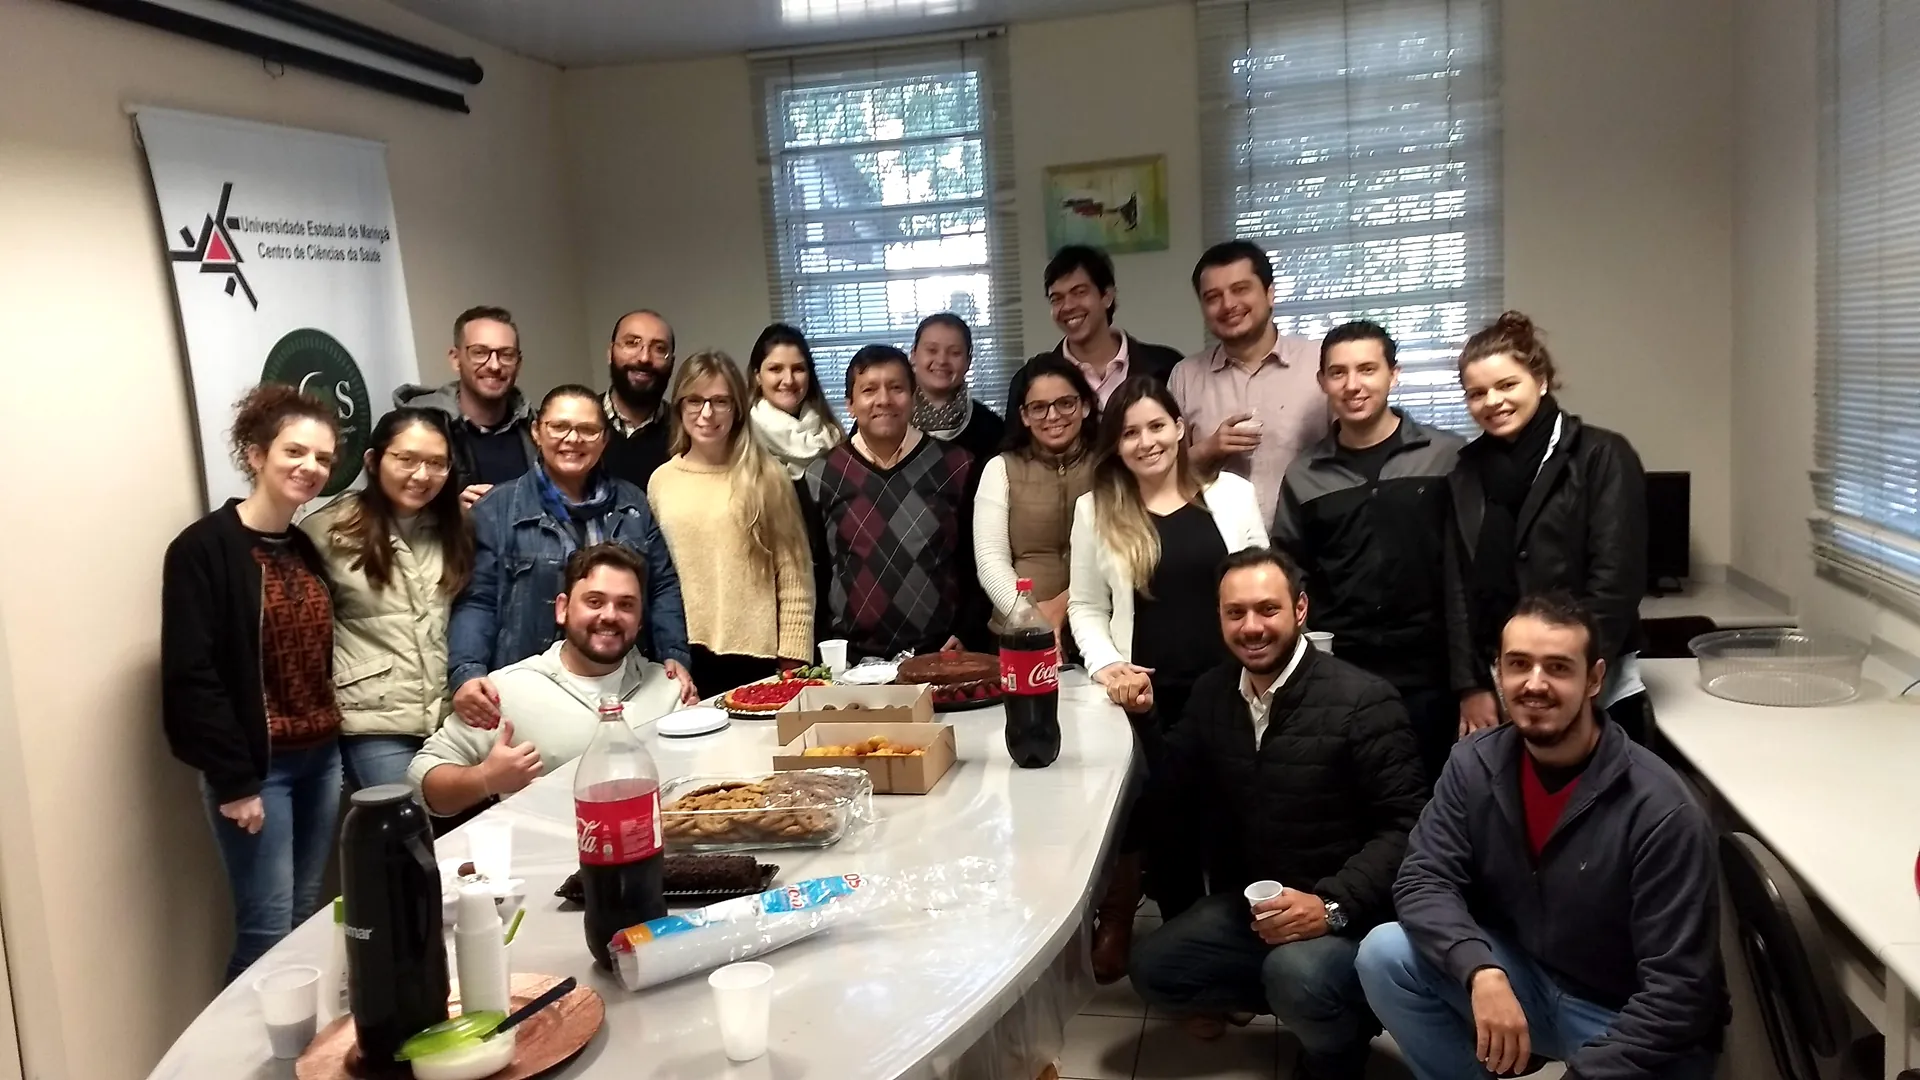
A team gathering in the graduate programme room, July 2019. 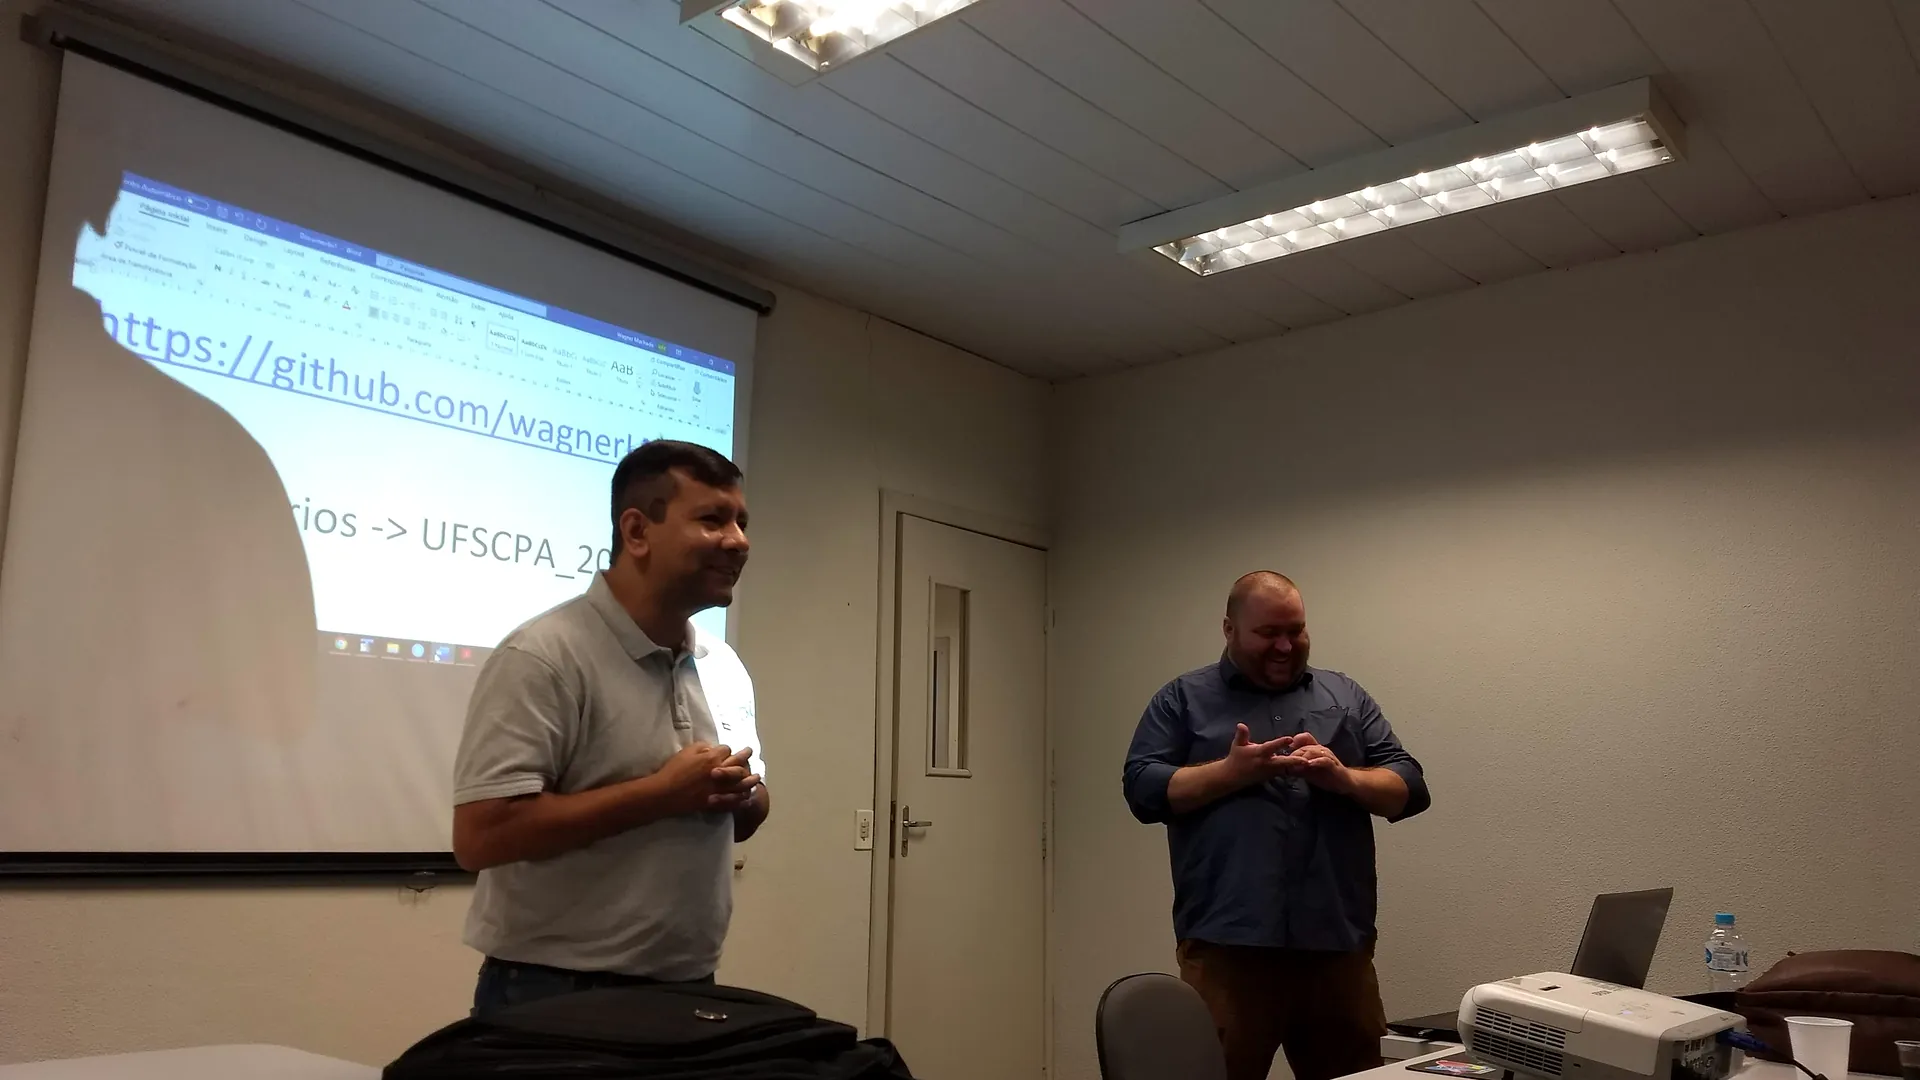
A training session built on material published in an open repository, December 2019. 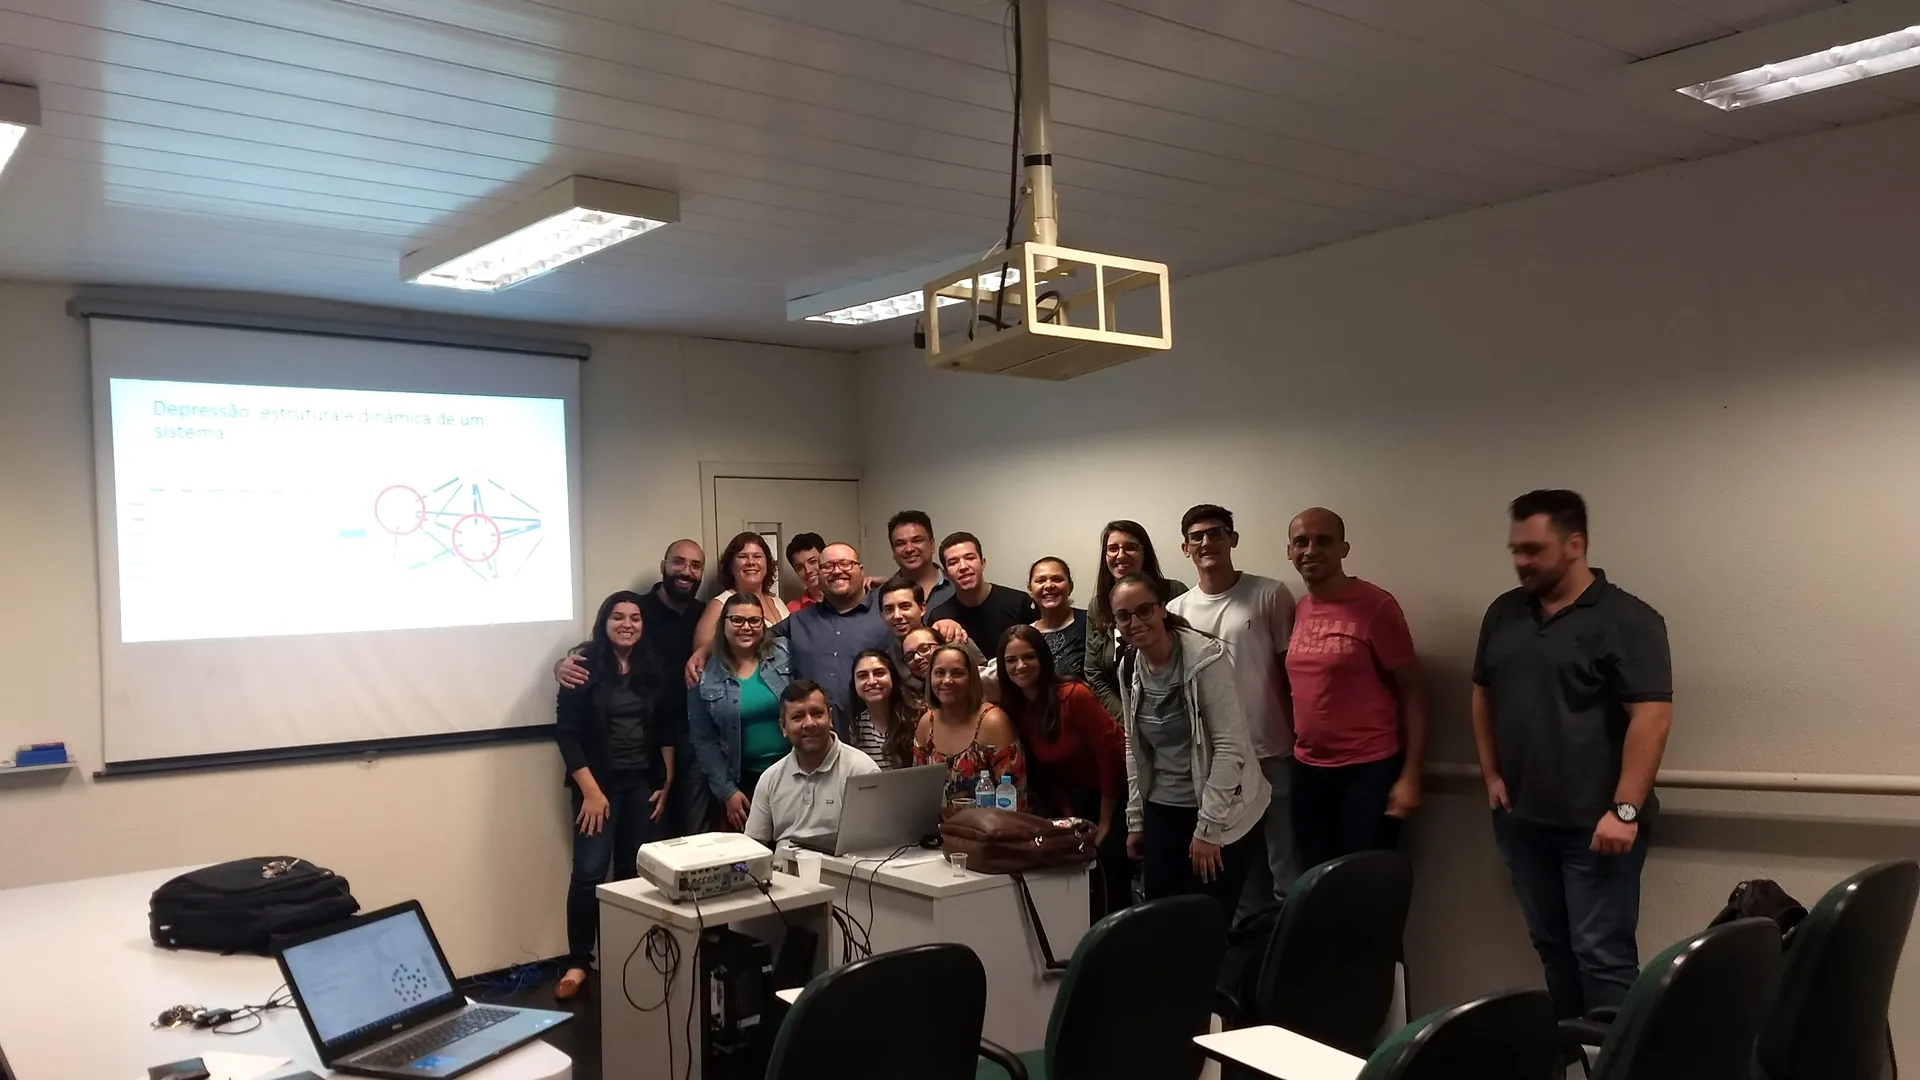
A full class at the end of one of the group’s courses, December 2019. 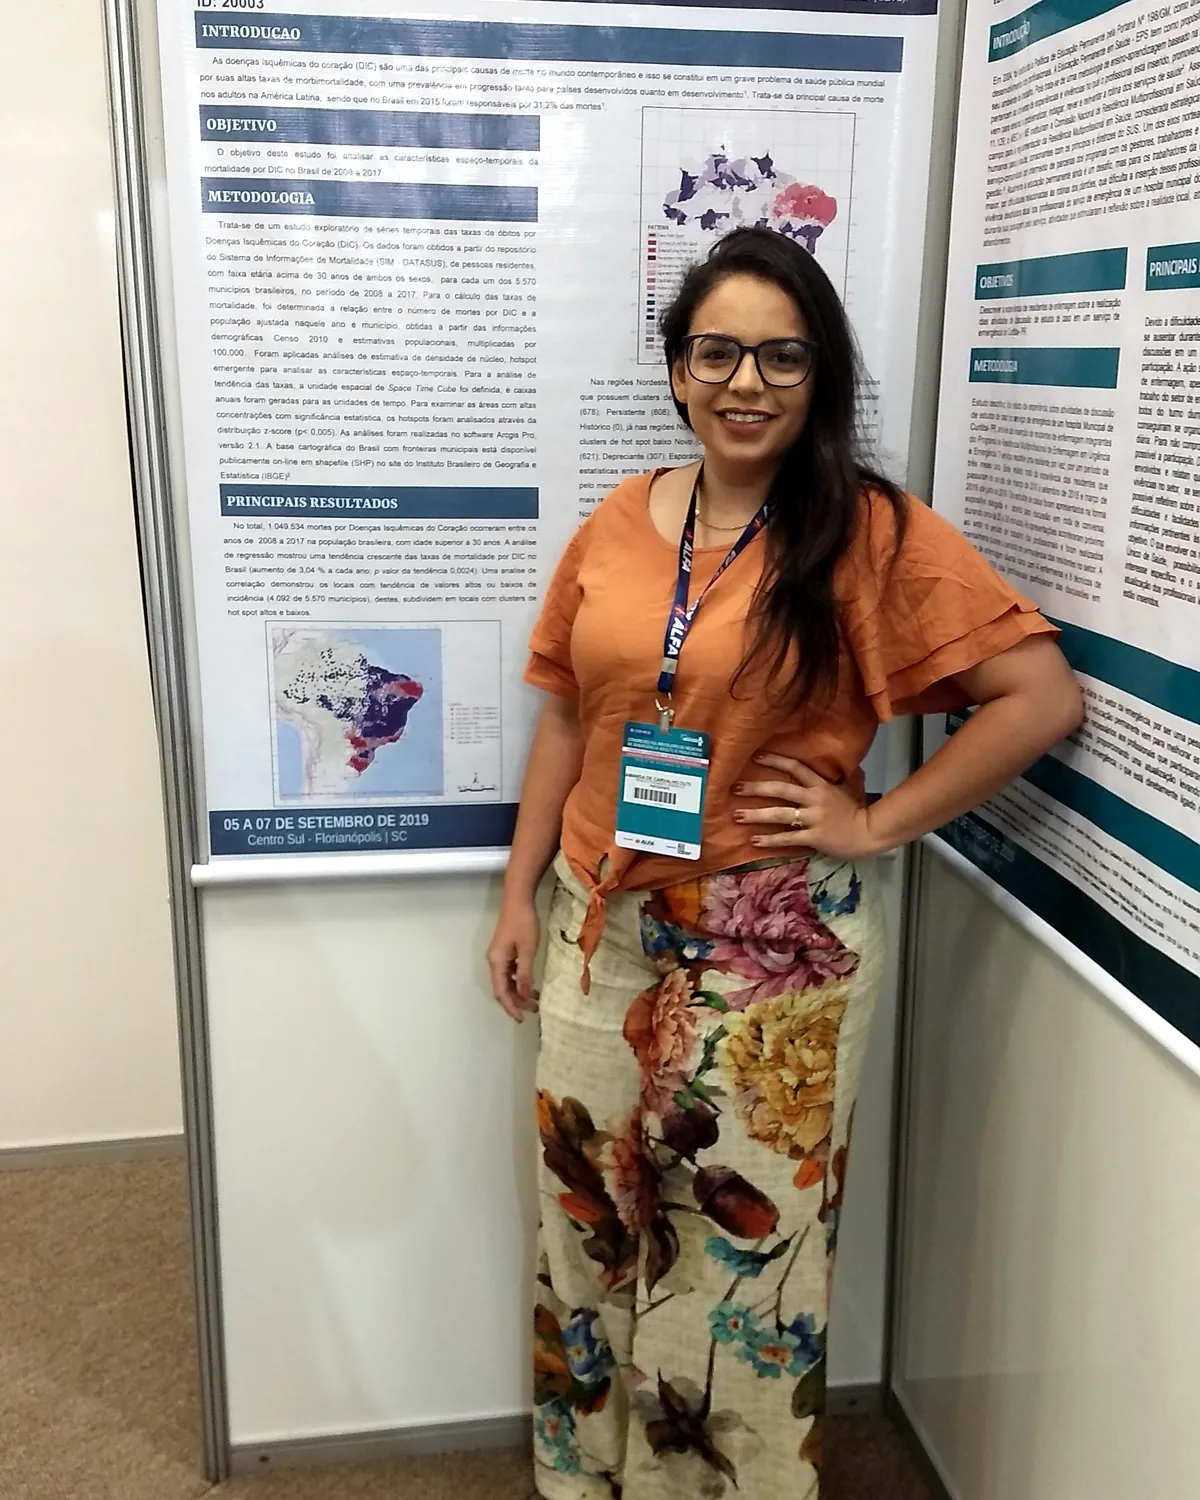
Presenting a scientific poster at a congress, September 2019. 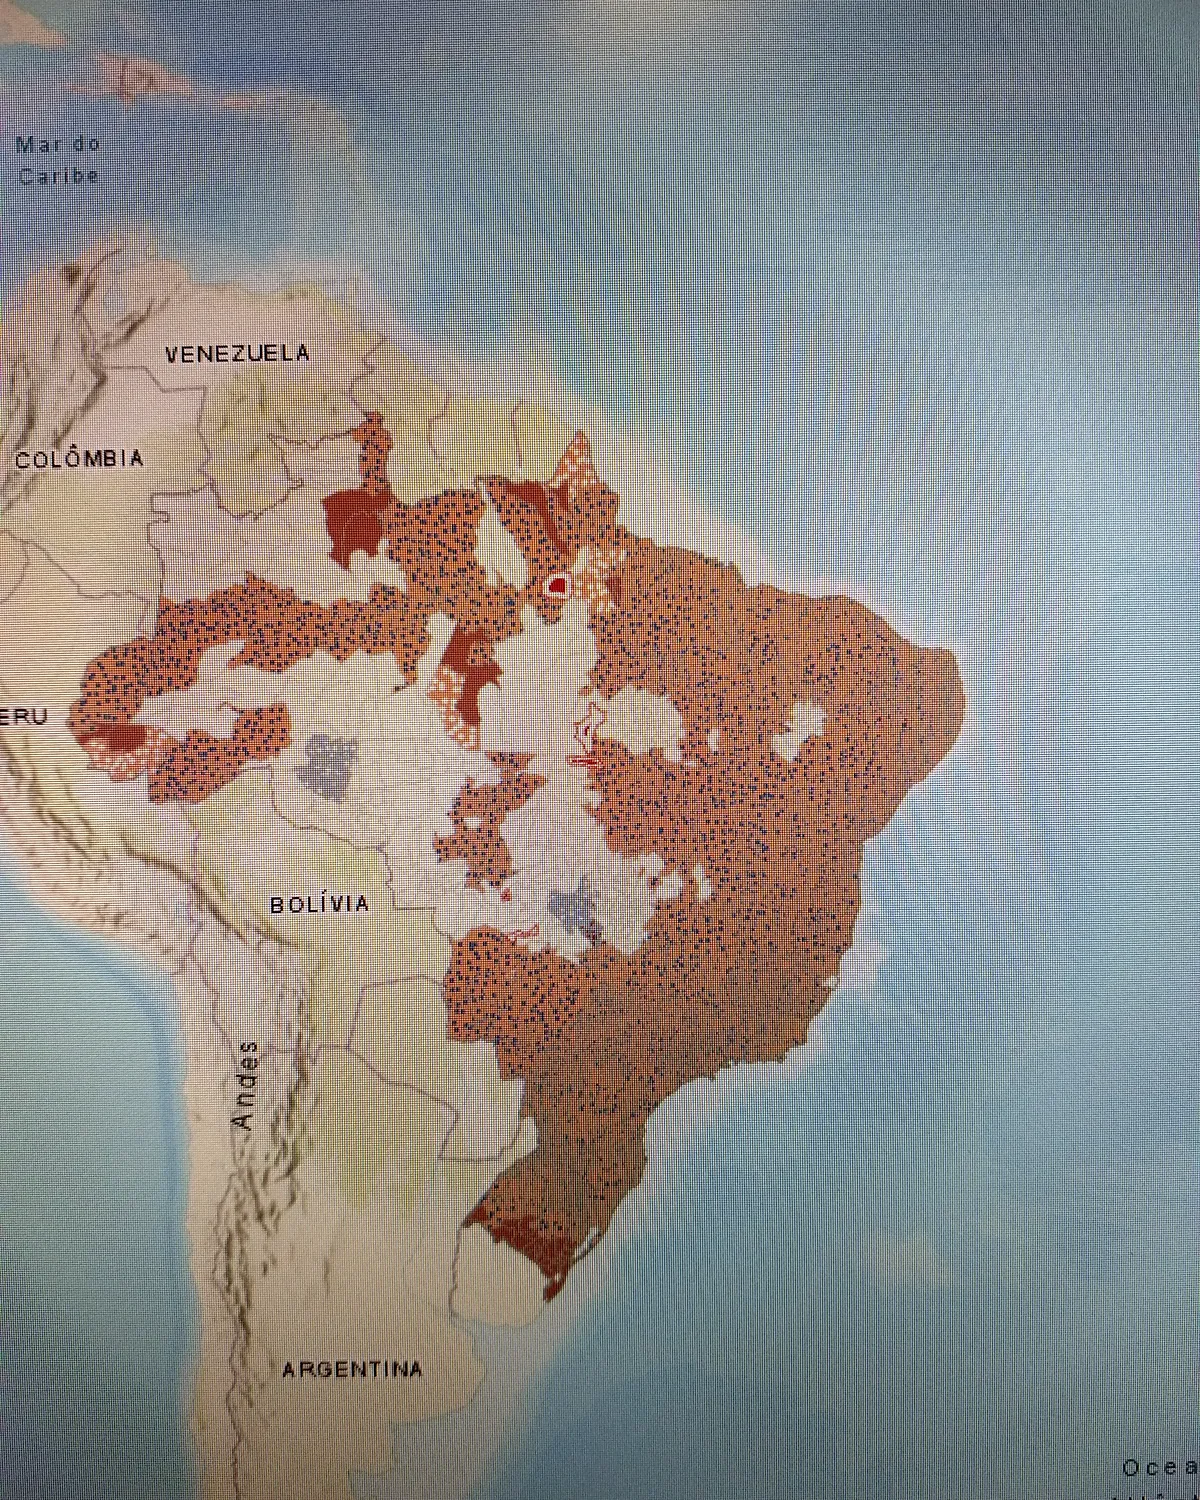
The country’s municipal mesh loaded for analysis, September 2019. - 20201 record
Between 6 March and 7 May 2020 the archive holds not a single image. When it resumes, the room has become a video call.
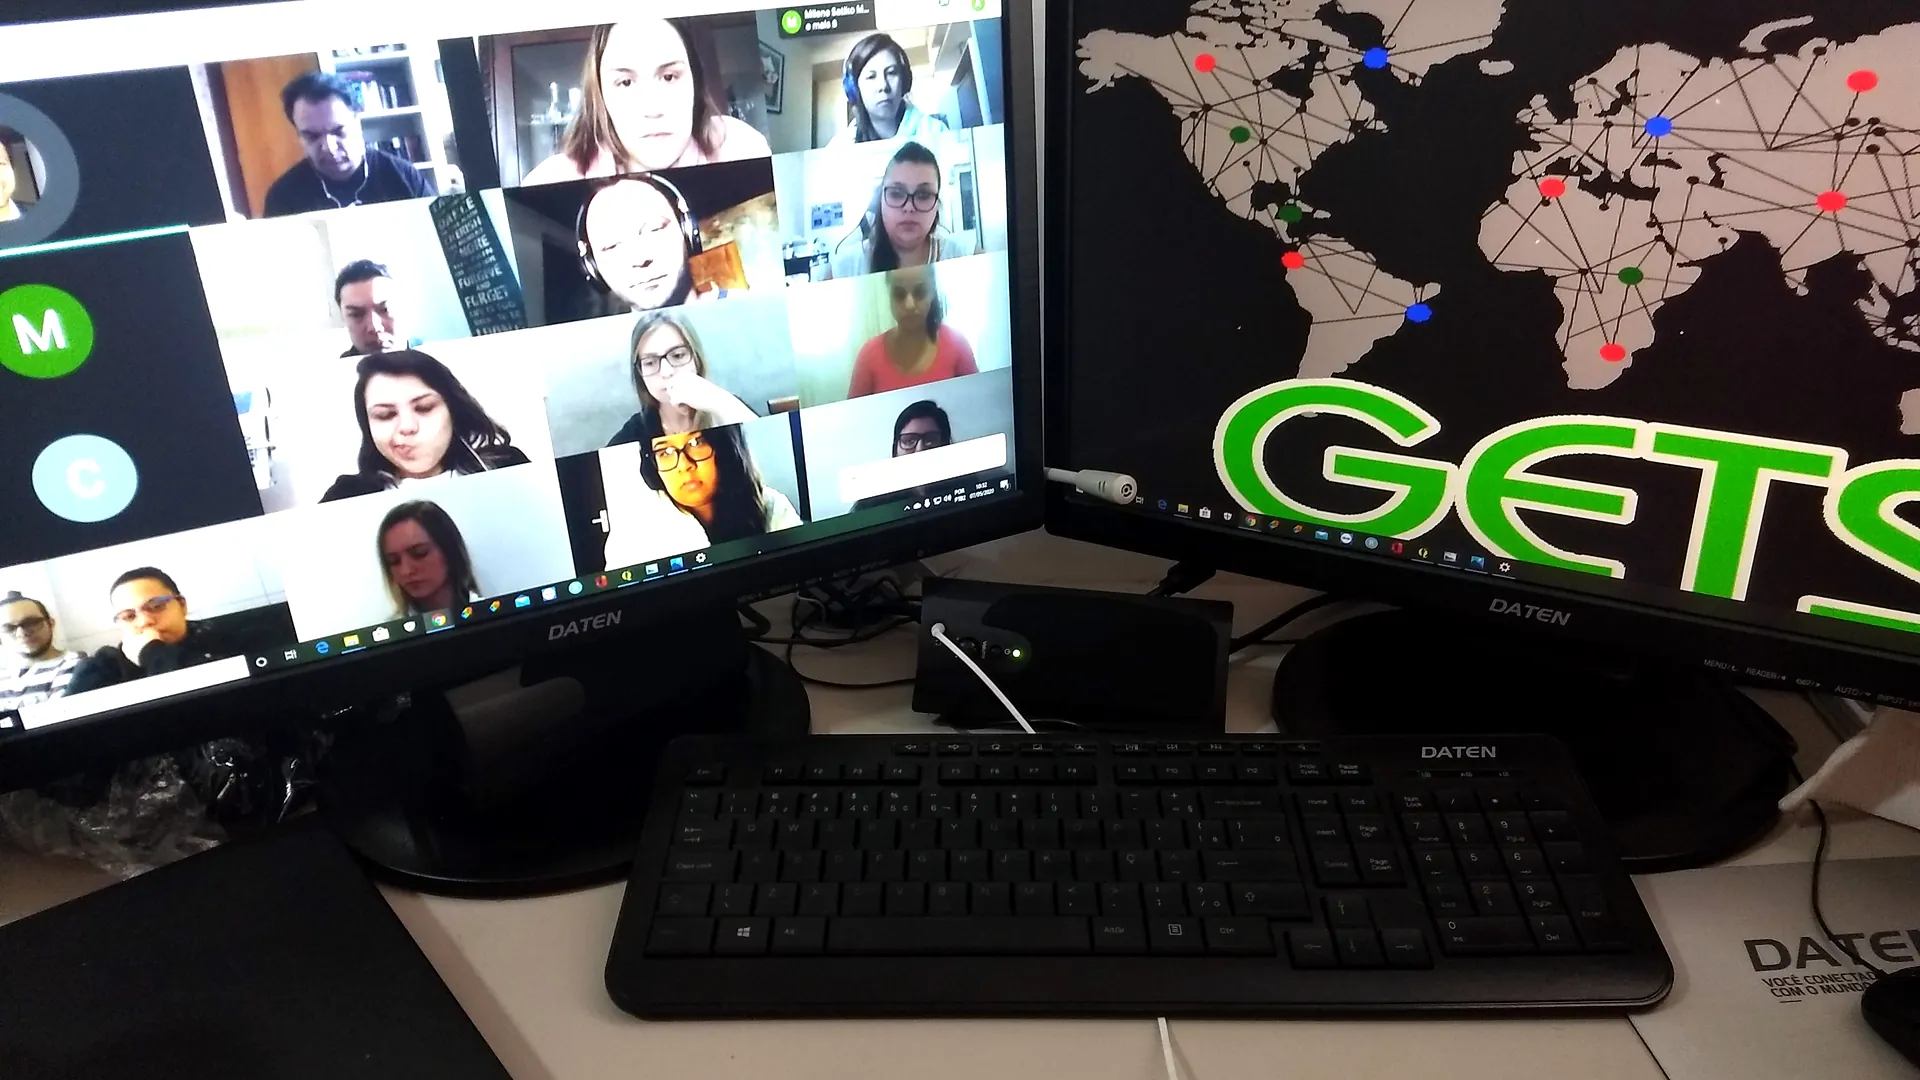
The group’s routine on a video call, beside the wordmark on the second screen, May 2020. - 20212 records
The work carries on through screens. In the second half of the year, lab coats and masks: in-person practice starts again.
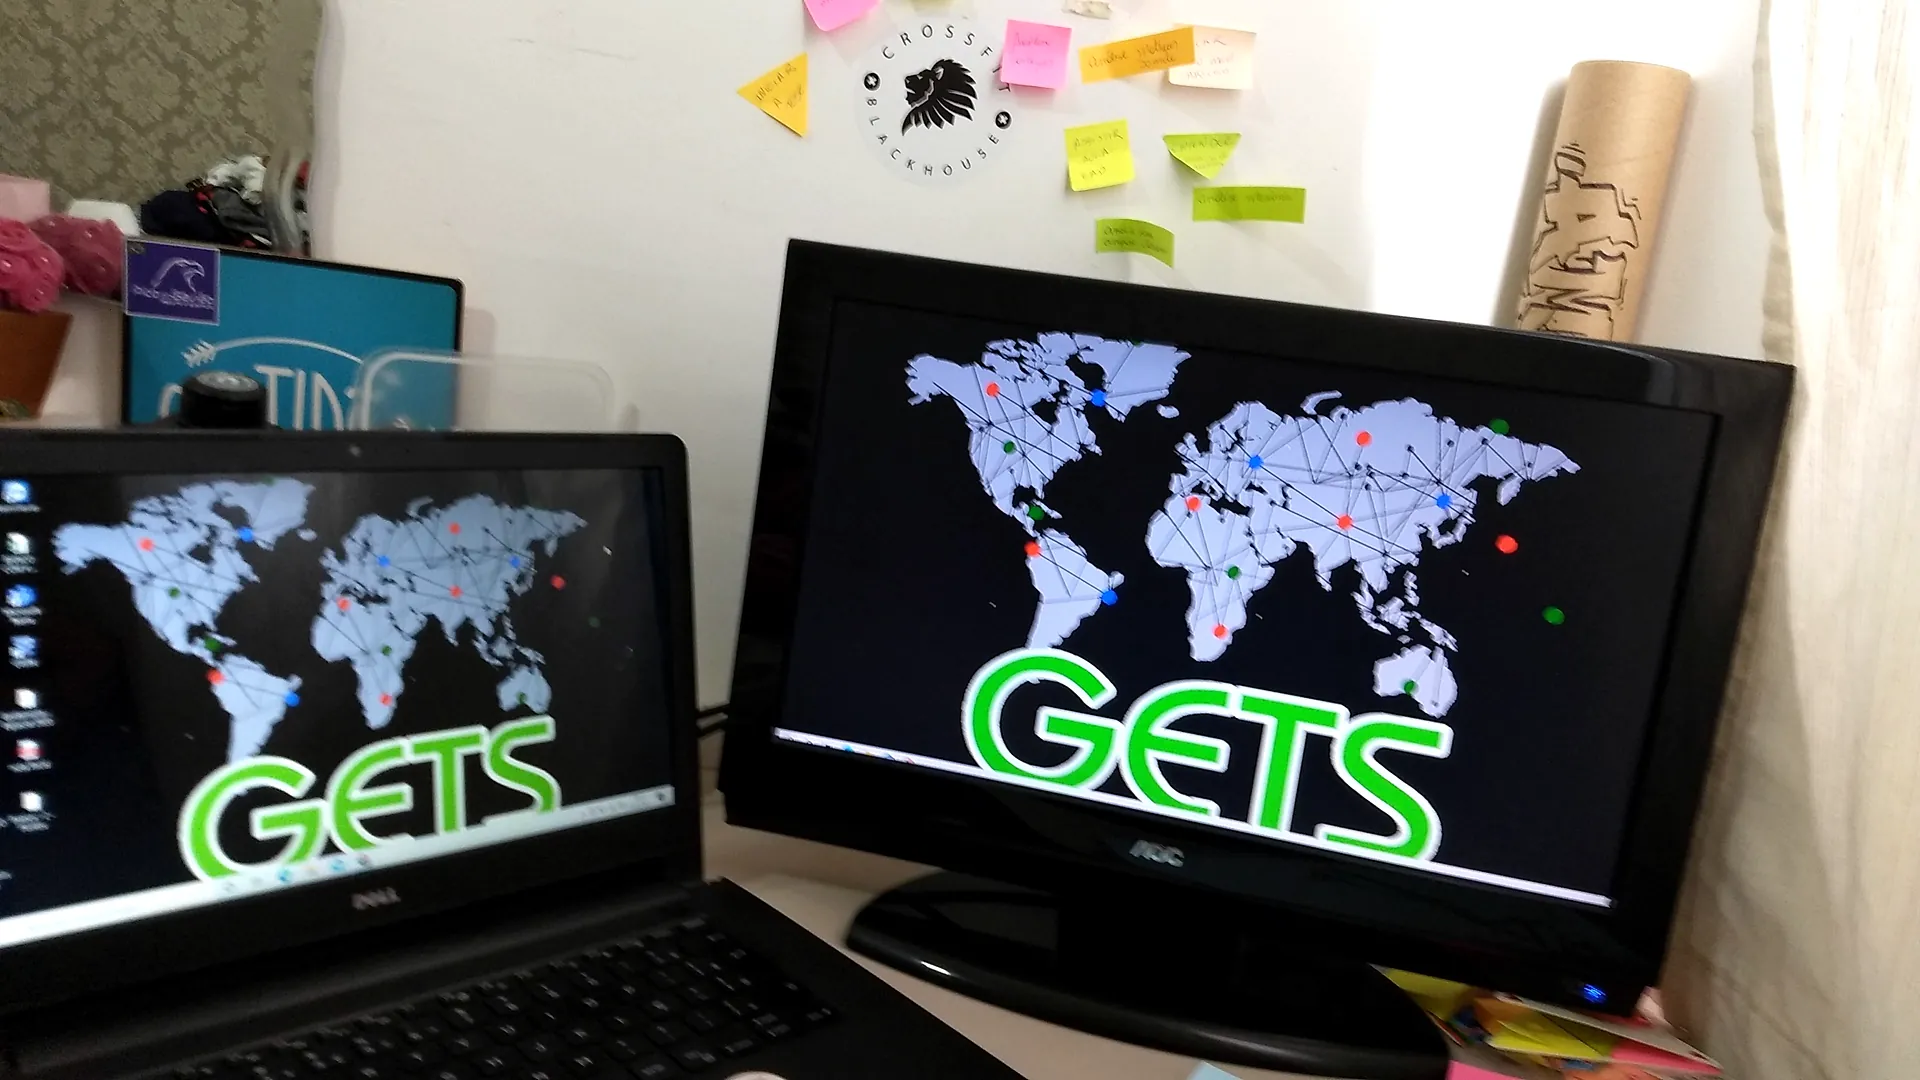
The group’s mark on the workstation screens, May 2021. 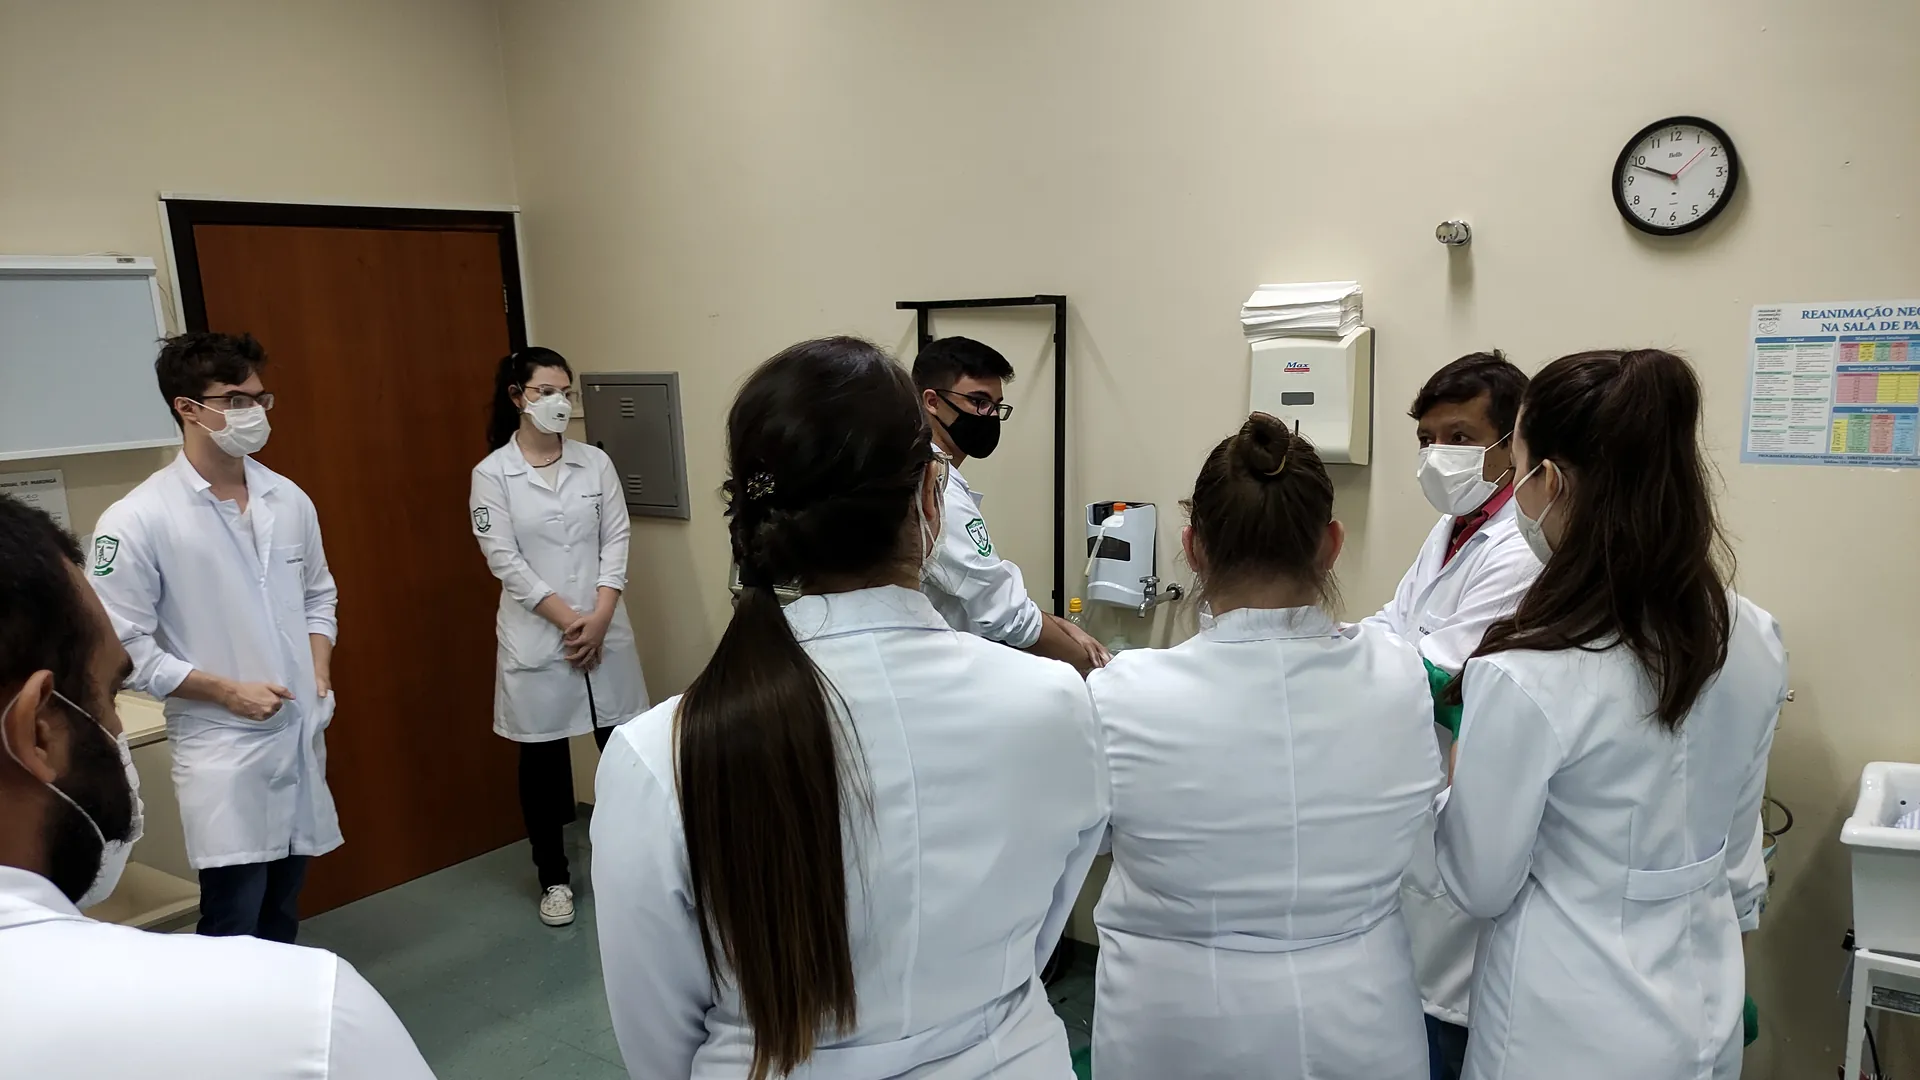
Hands-on activity with students in lab coats and masks, September 2021. - 20224 records
The workstations fill up again. New material with the current identity, simulation, and in-person seminars with a network analysis back on screen.
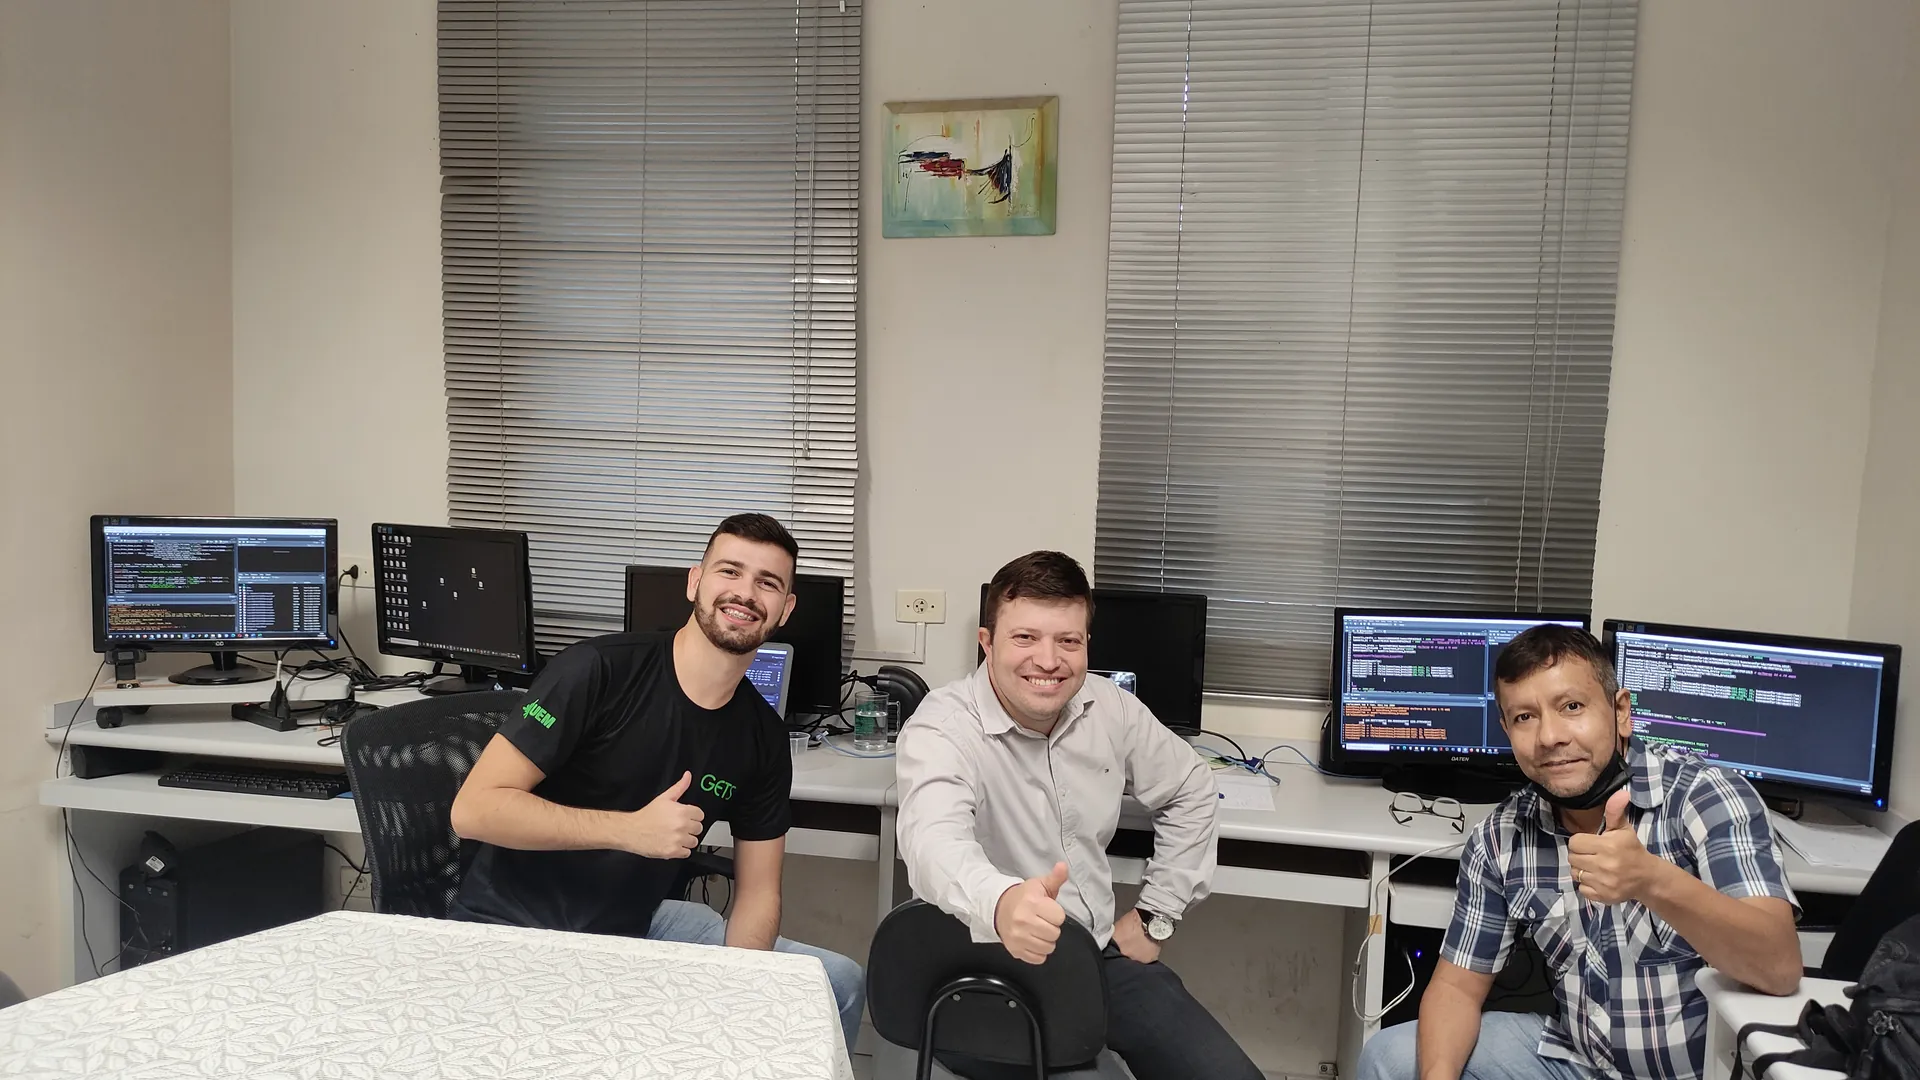
The analysis workstations in operation, March 2022. 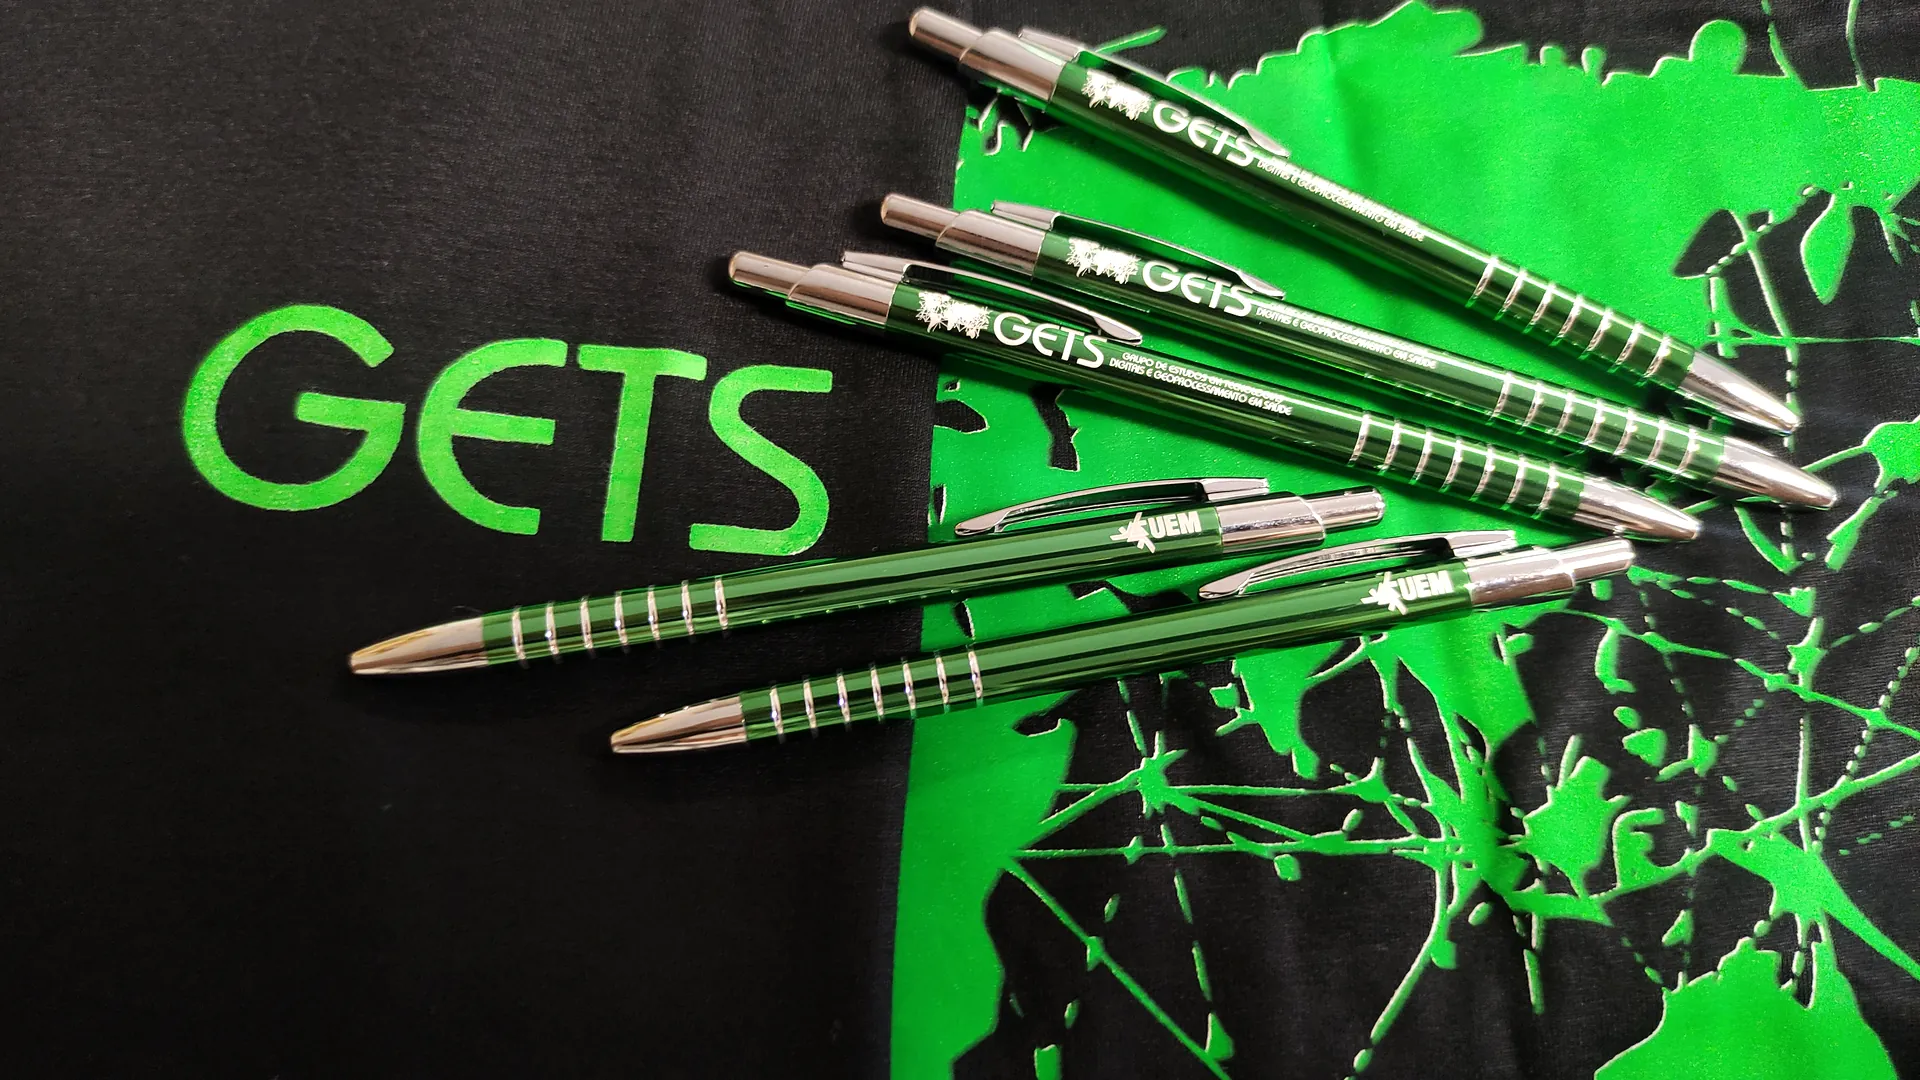
Group material carrying the current version of the world map, February 2022. 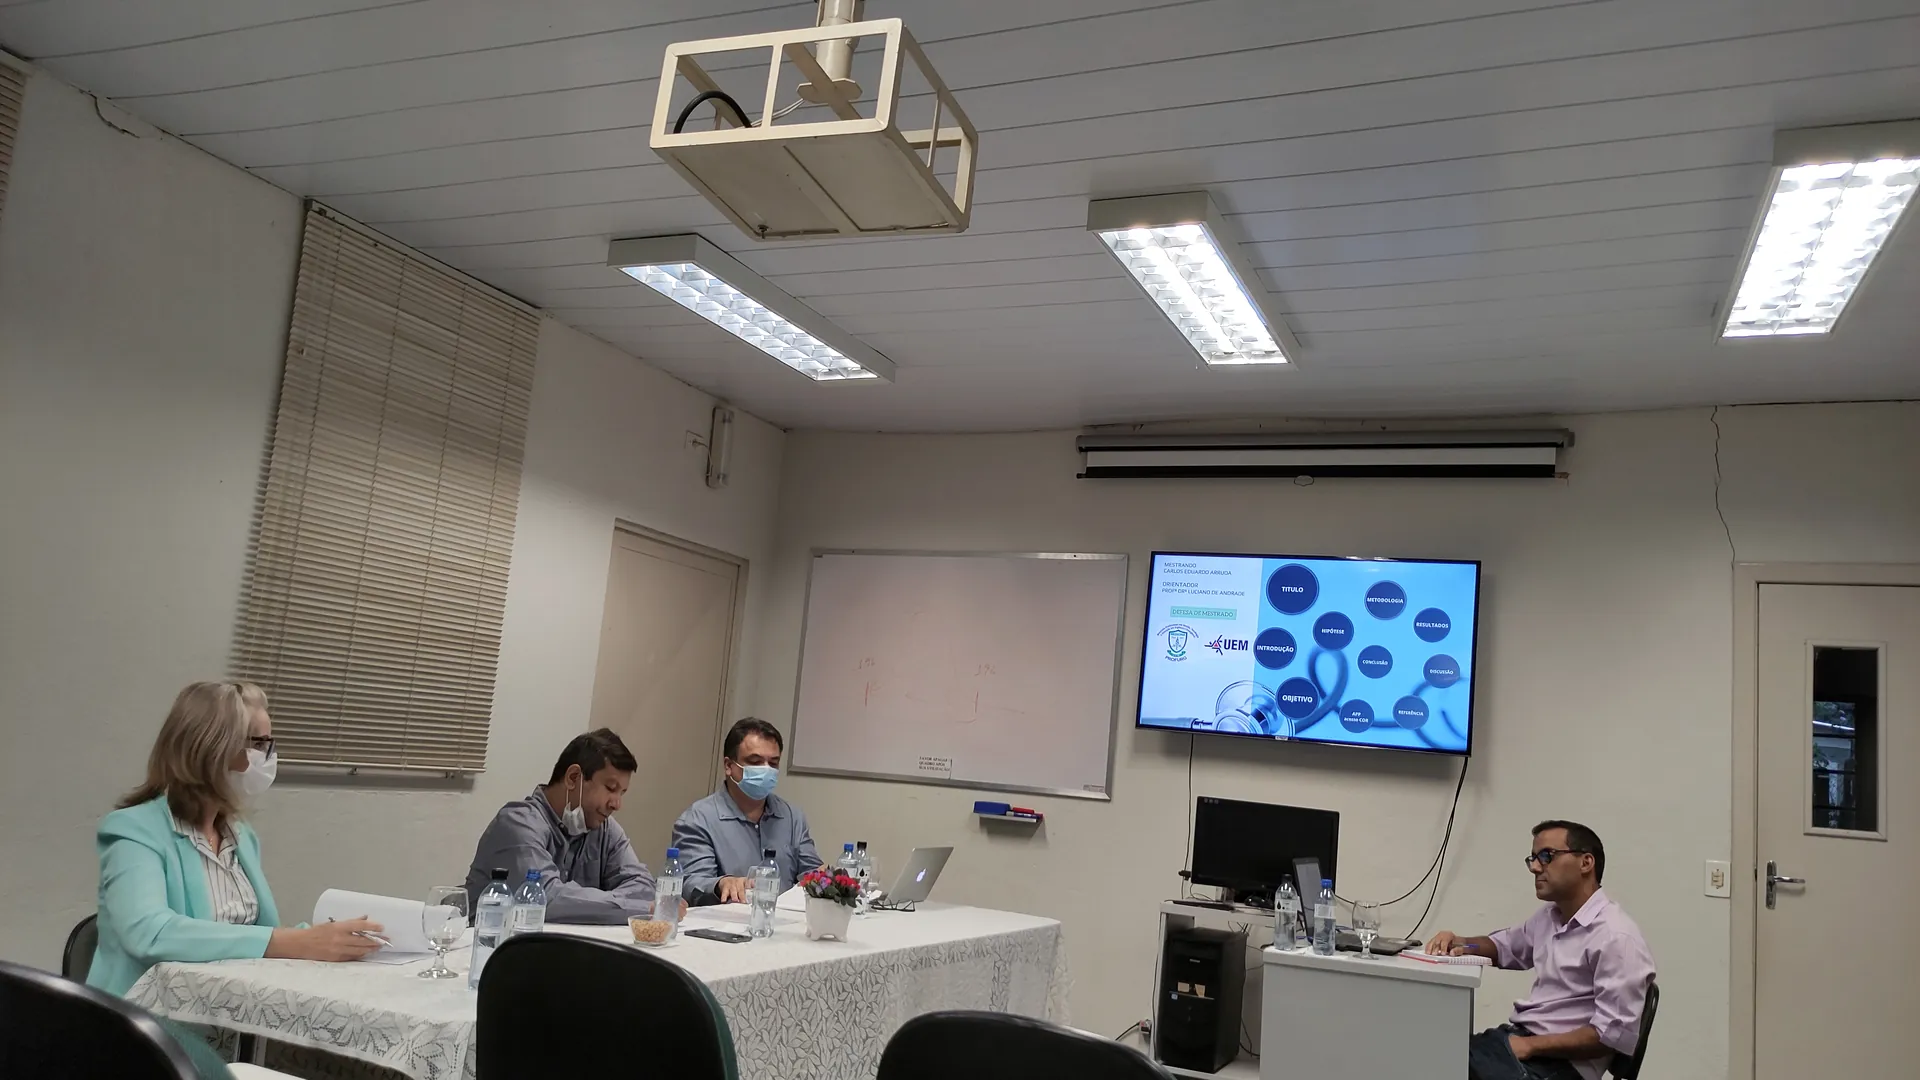
An in-person seminar with a network analysis on screen, May 2022. 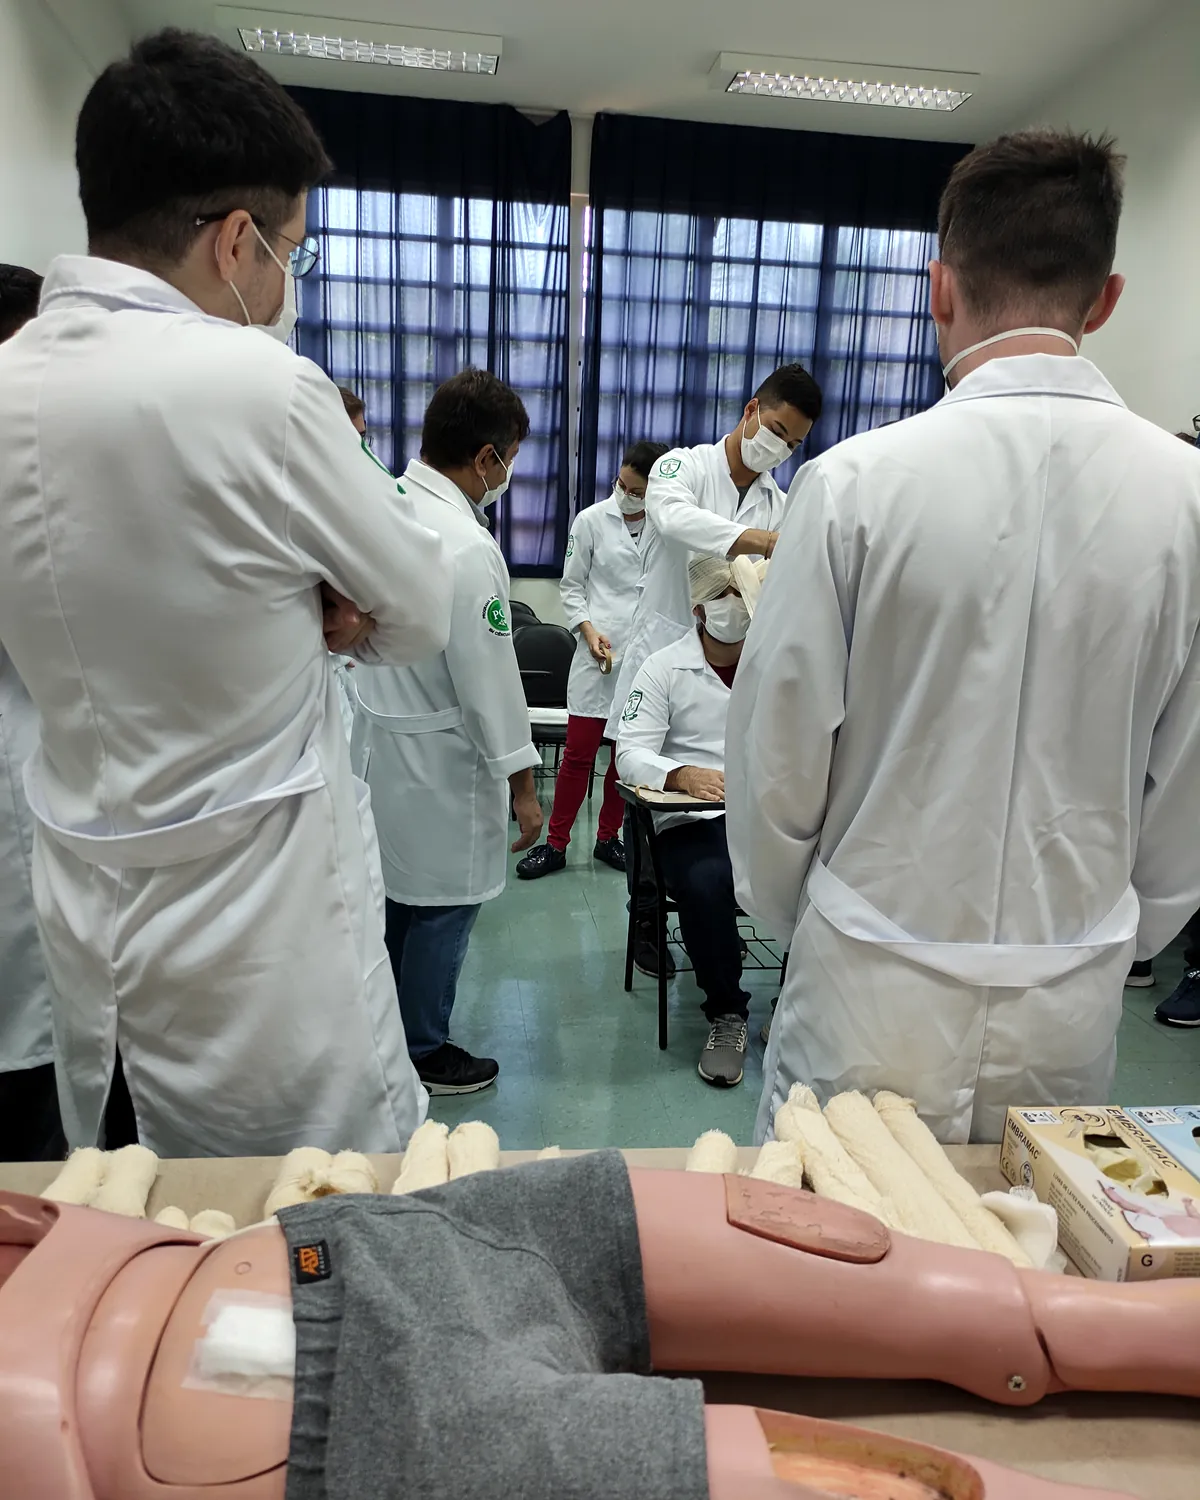
Practice on a simulation manikin, March 2022. - 20231 record
Scientific meetings, wearing the group’s shirt.
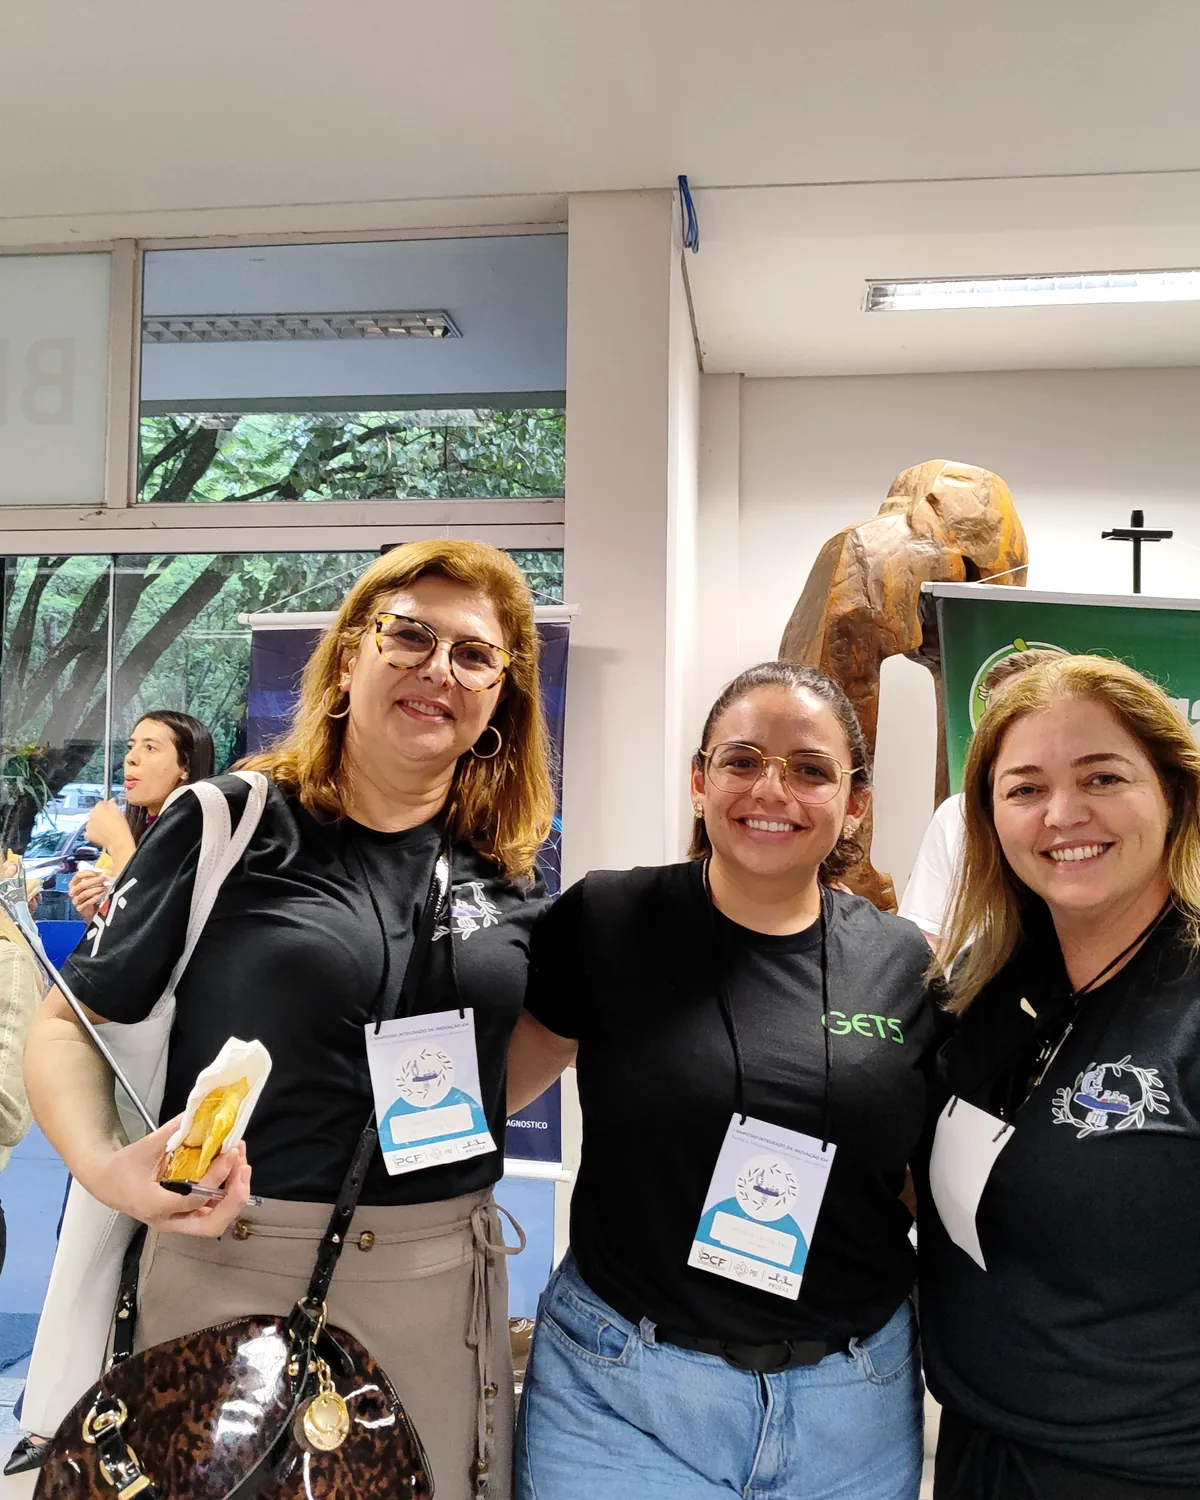
Group members at a scientific meeting, October 2023. - 20242 records
Posters and the team at the 19th EIPCS and 17th CICS, inside UEM.
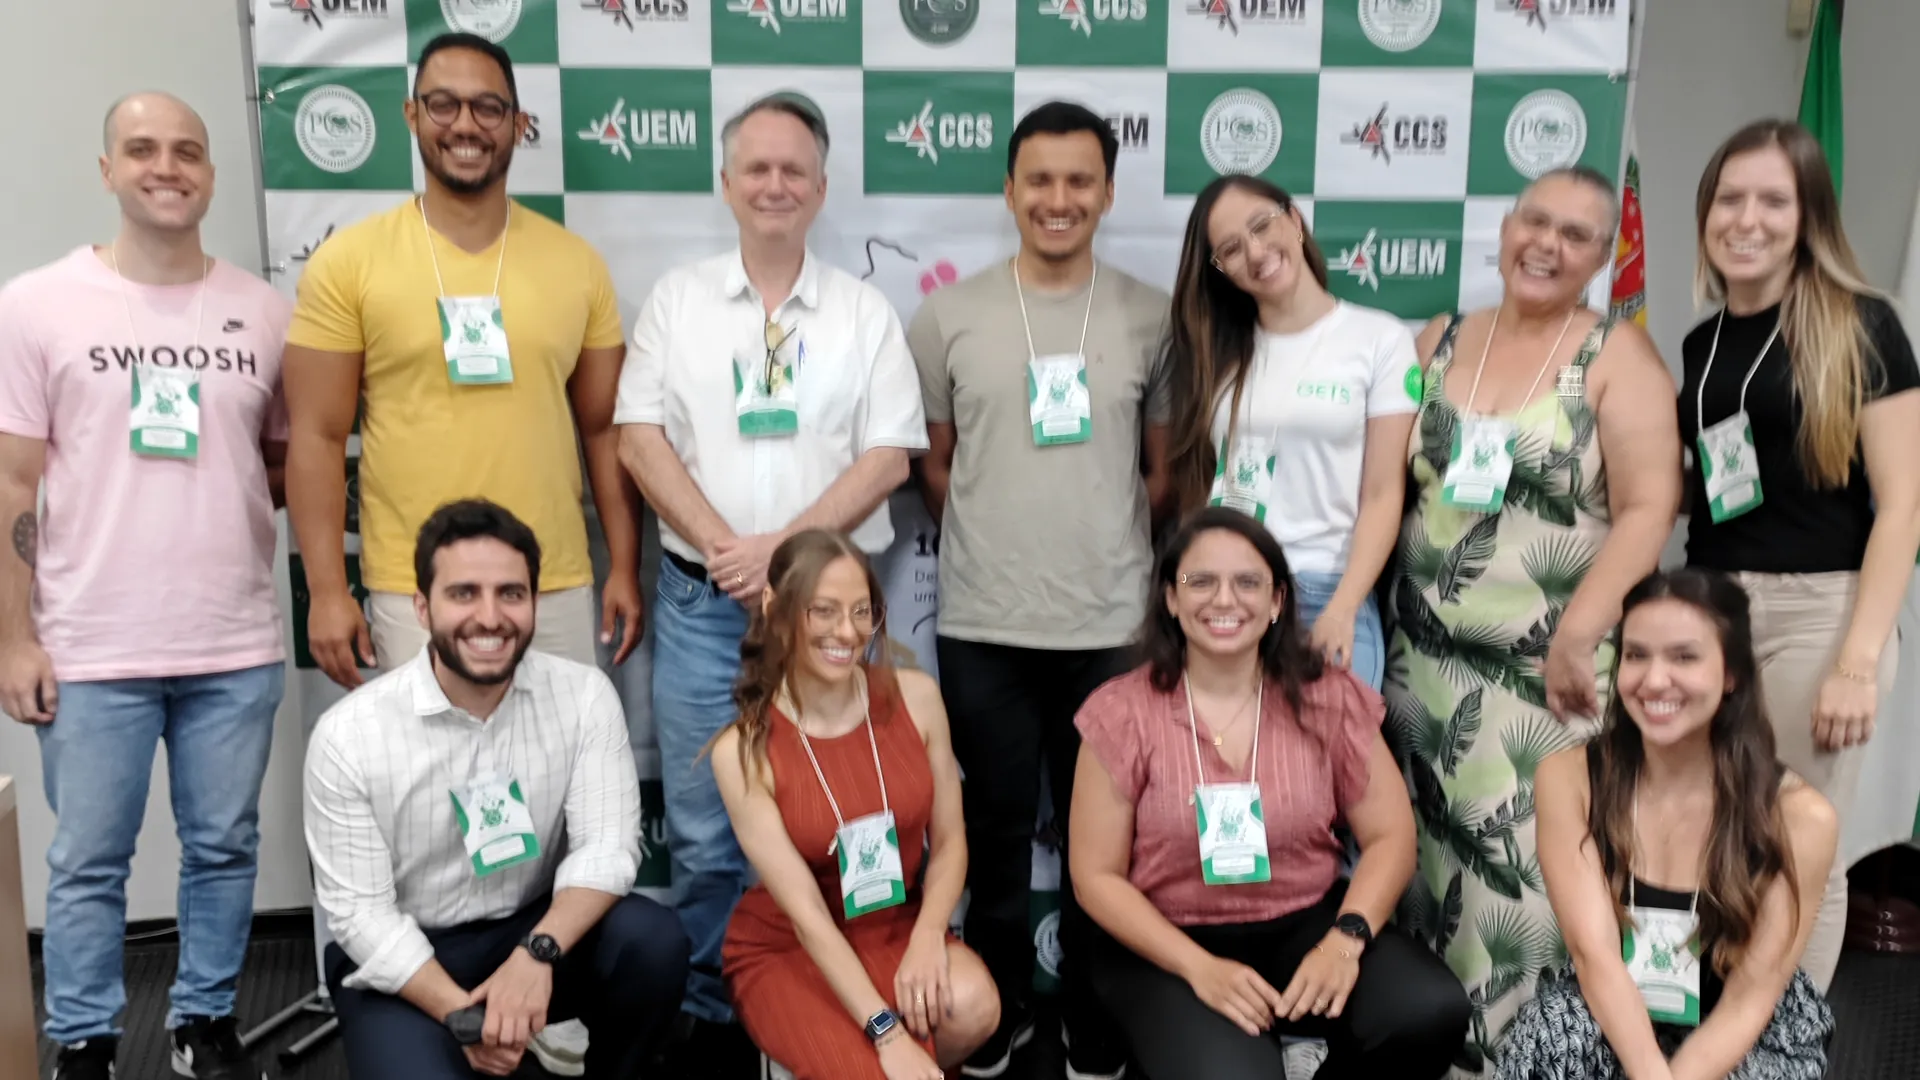
The team at the 19th EIPCS and 17th CICS, September 2024. 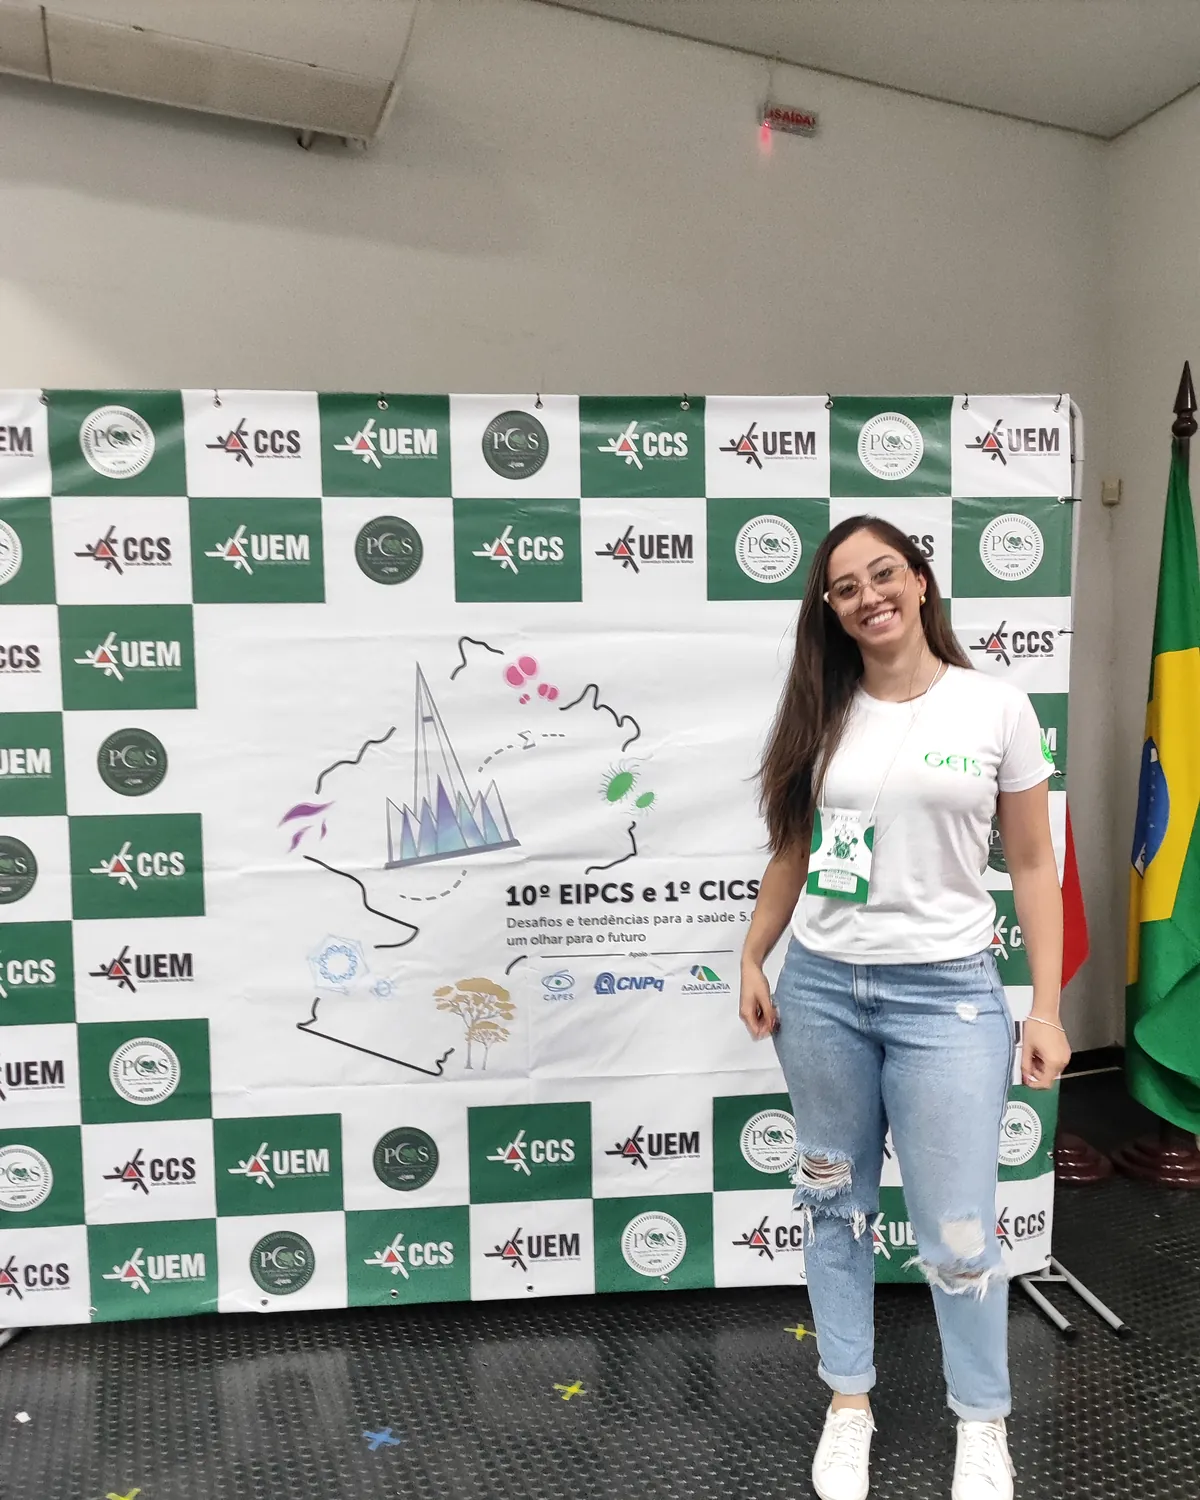
Presenting at the 19th EIPCS and 17th CICS, at UEM, September 2024. - 20252 records
Today’s team, and a partnership with SAMU 192 Regional Norte Novo organising an event on stroke in prehospital care.
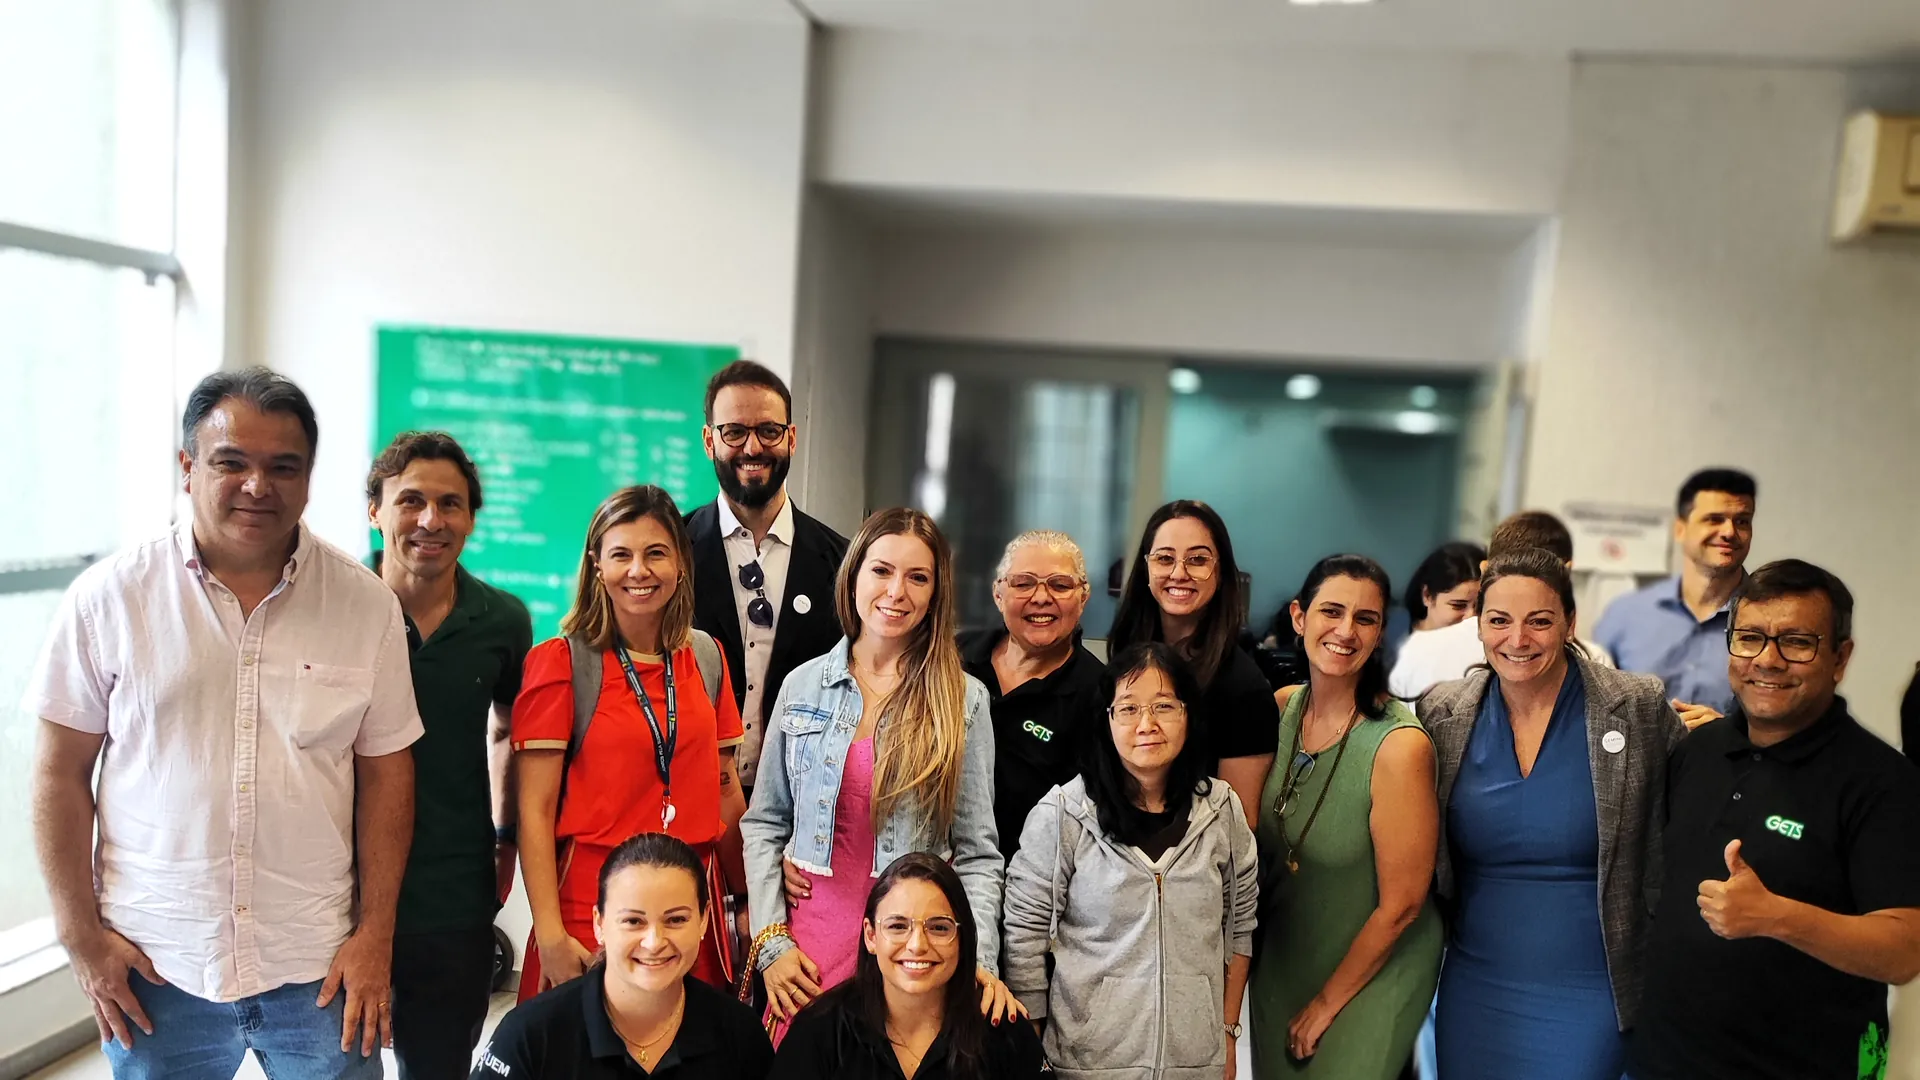
The team together at UEM, April 2025. 
The group and PROFURG teams organising an event on stroke in prehospital care, with SAMU 192 Regional Norte Novo, May 2025.
The signature changed more than once.
The archive holds records of two signatures: a short one, “Tecnologias e Saúde”, and a long one that adds “Tecnologias Digitais e Geoprocessamento”. The C3 rebranding signs with the short name and moves the map inside the G.
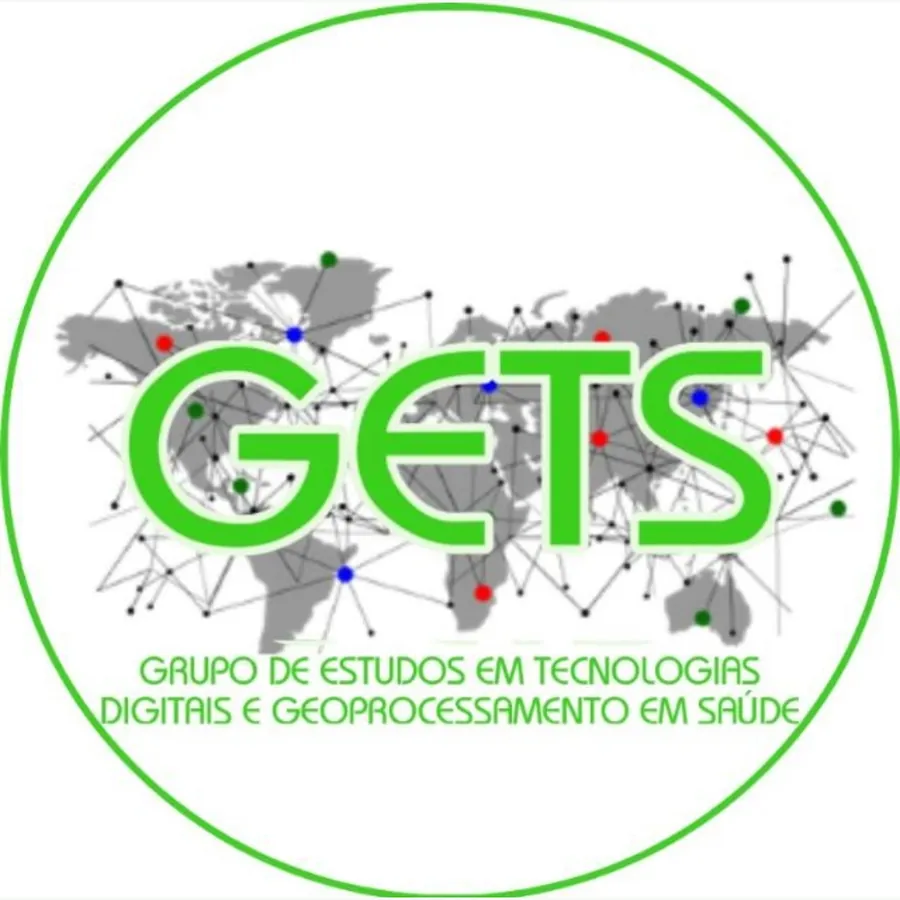
The mark off the screen
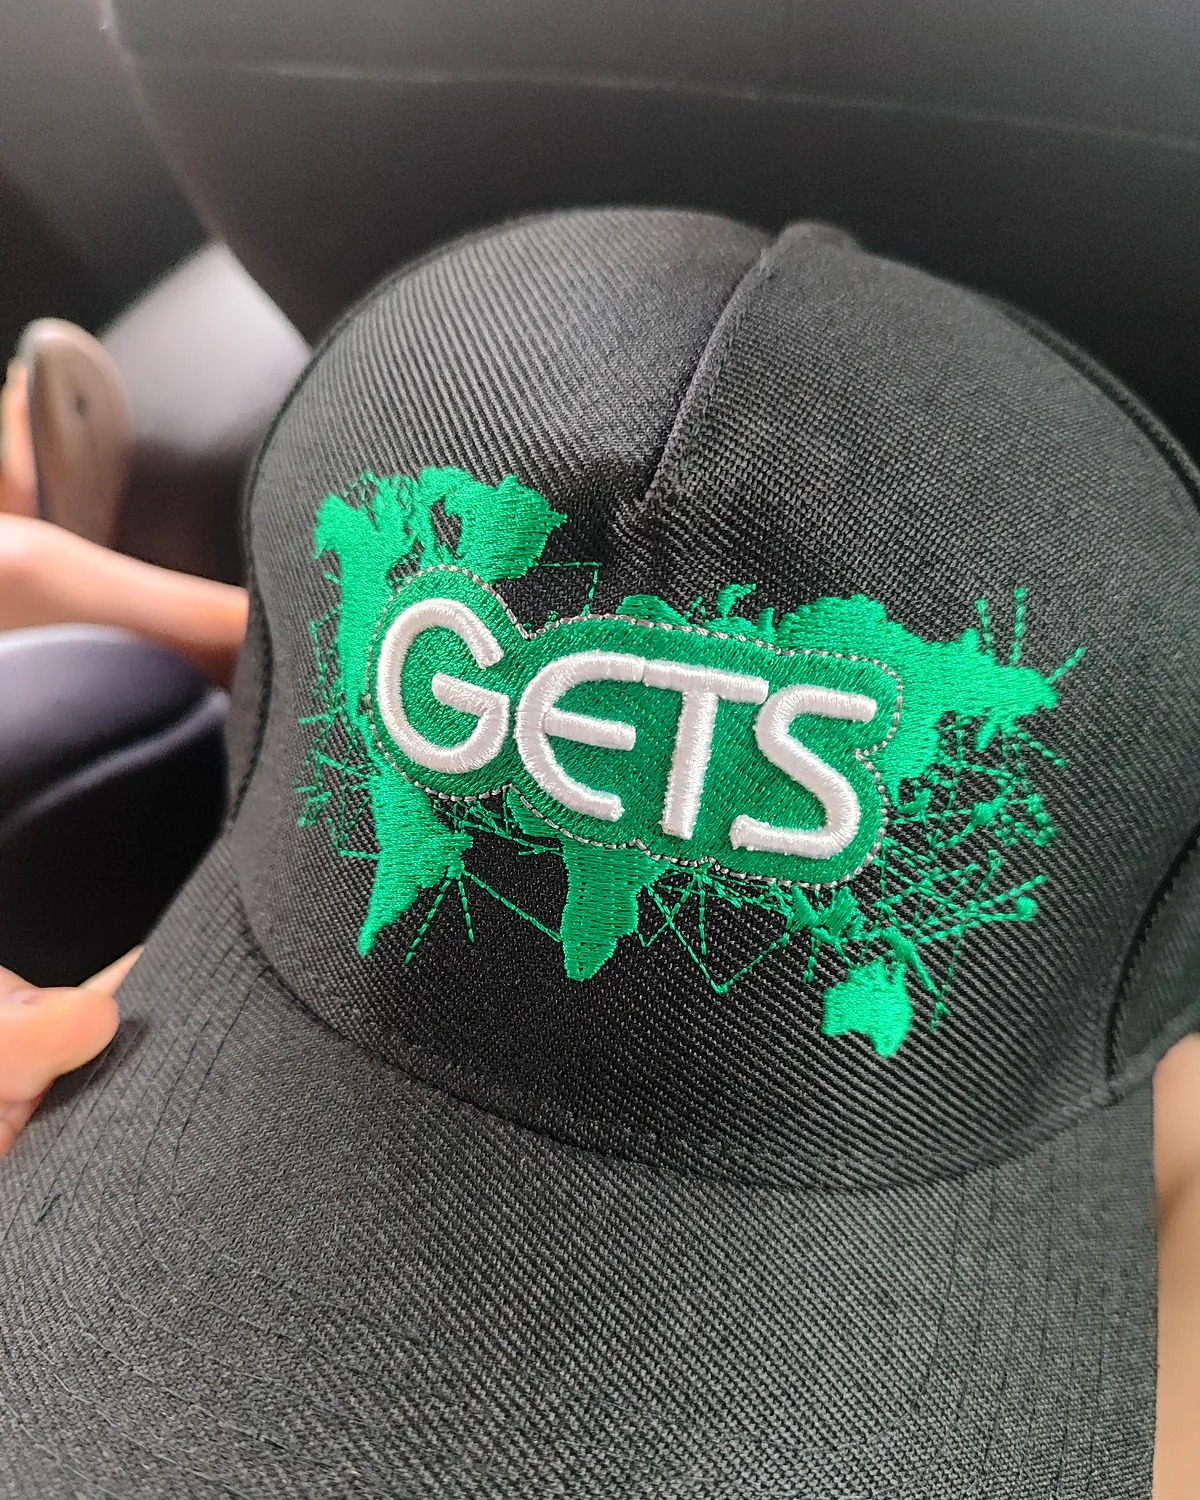
Archive pieces, carrying earlier signatures.
Maps, not illustrations.
The figures below are real analysis outputs produced by the group, reproduced without any edit to their content. All of them cover Paraná State.
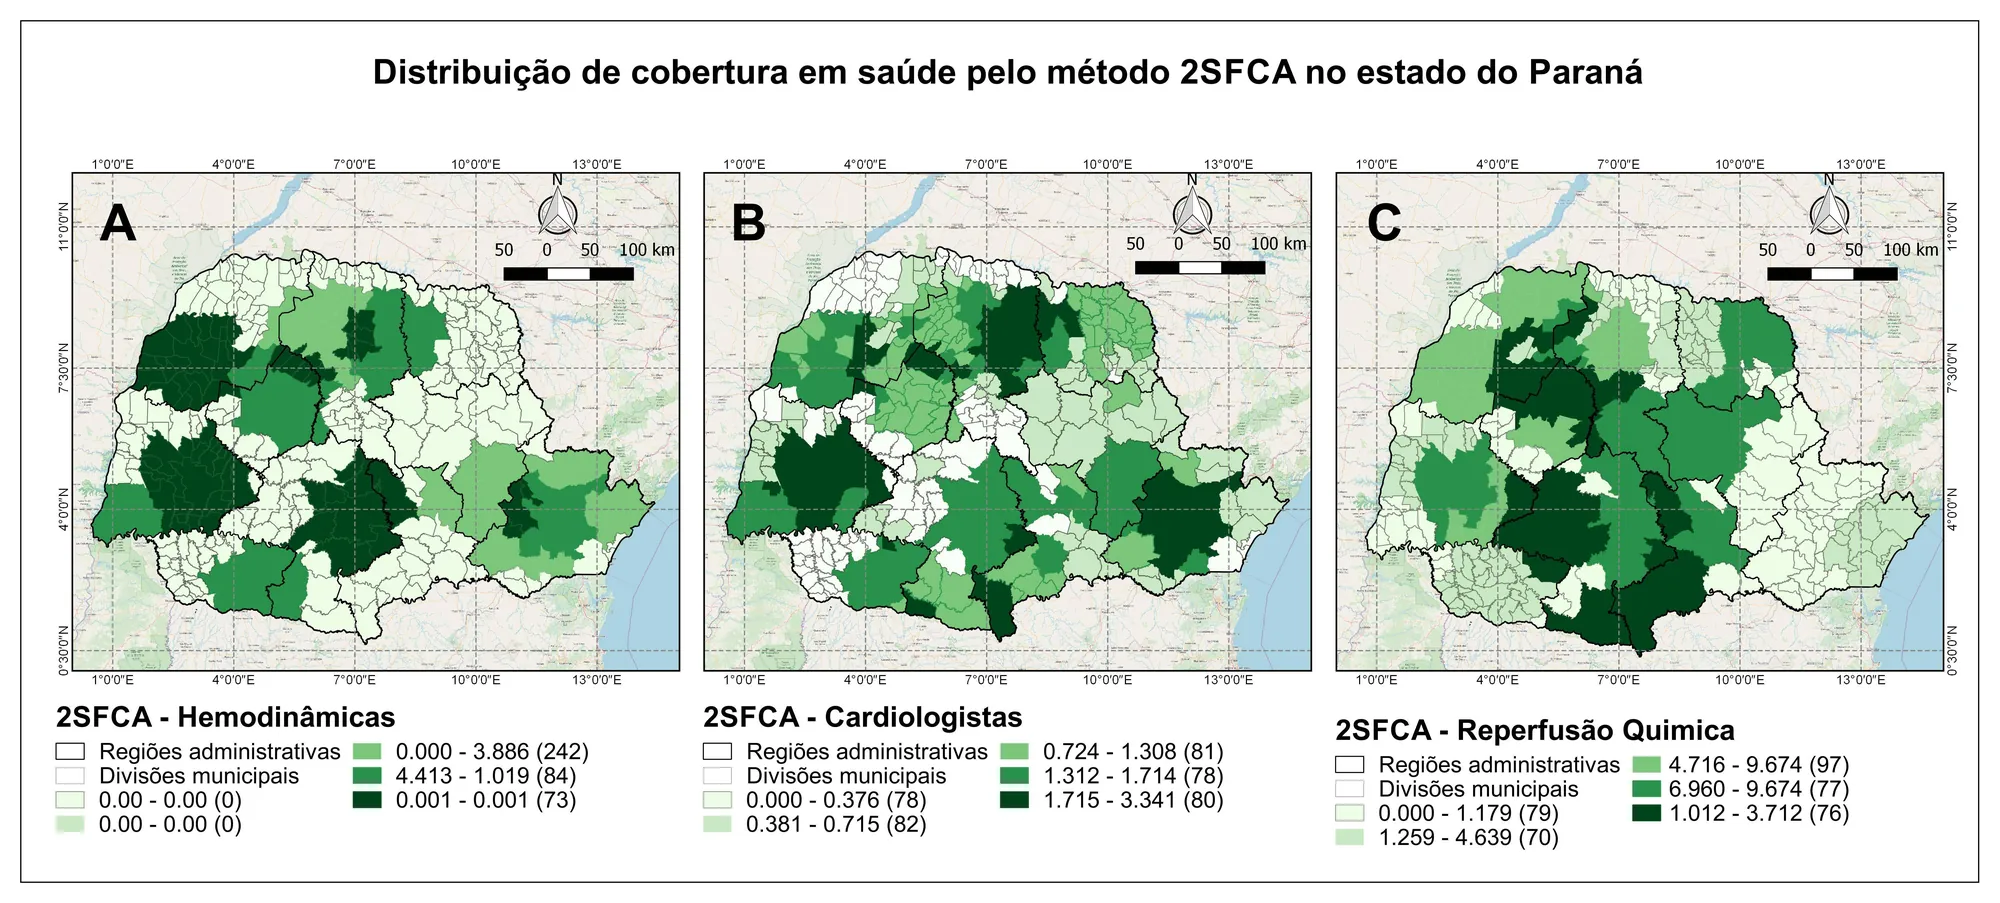
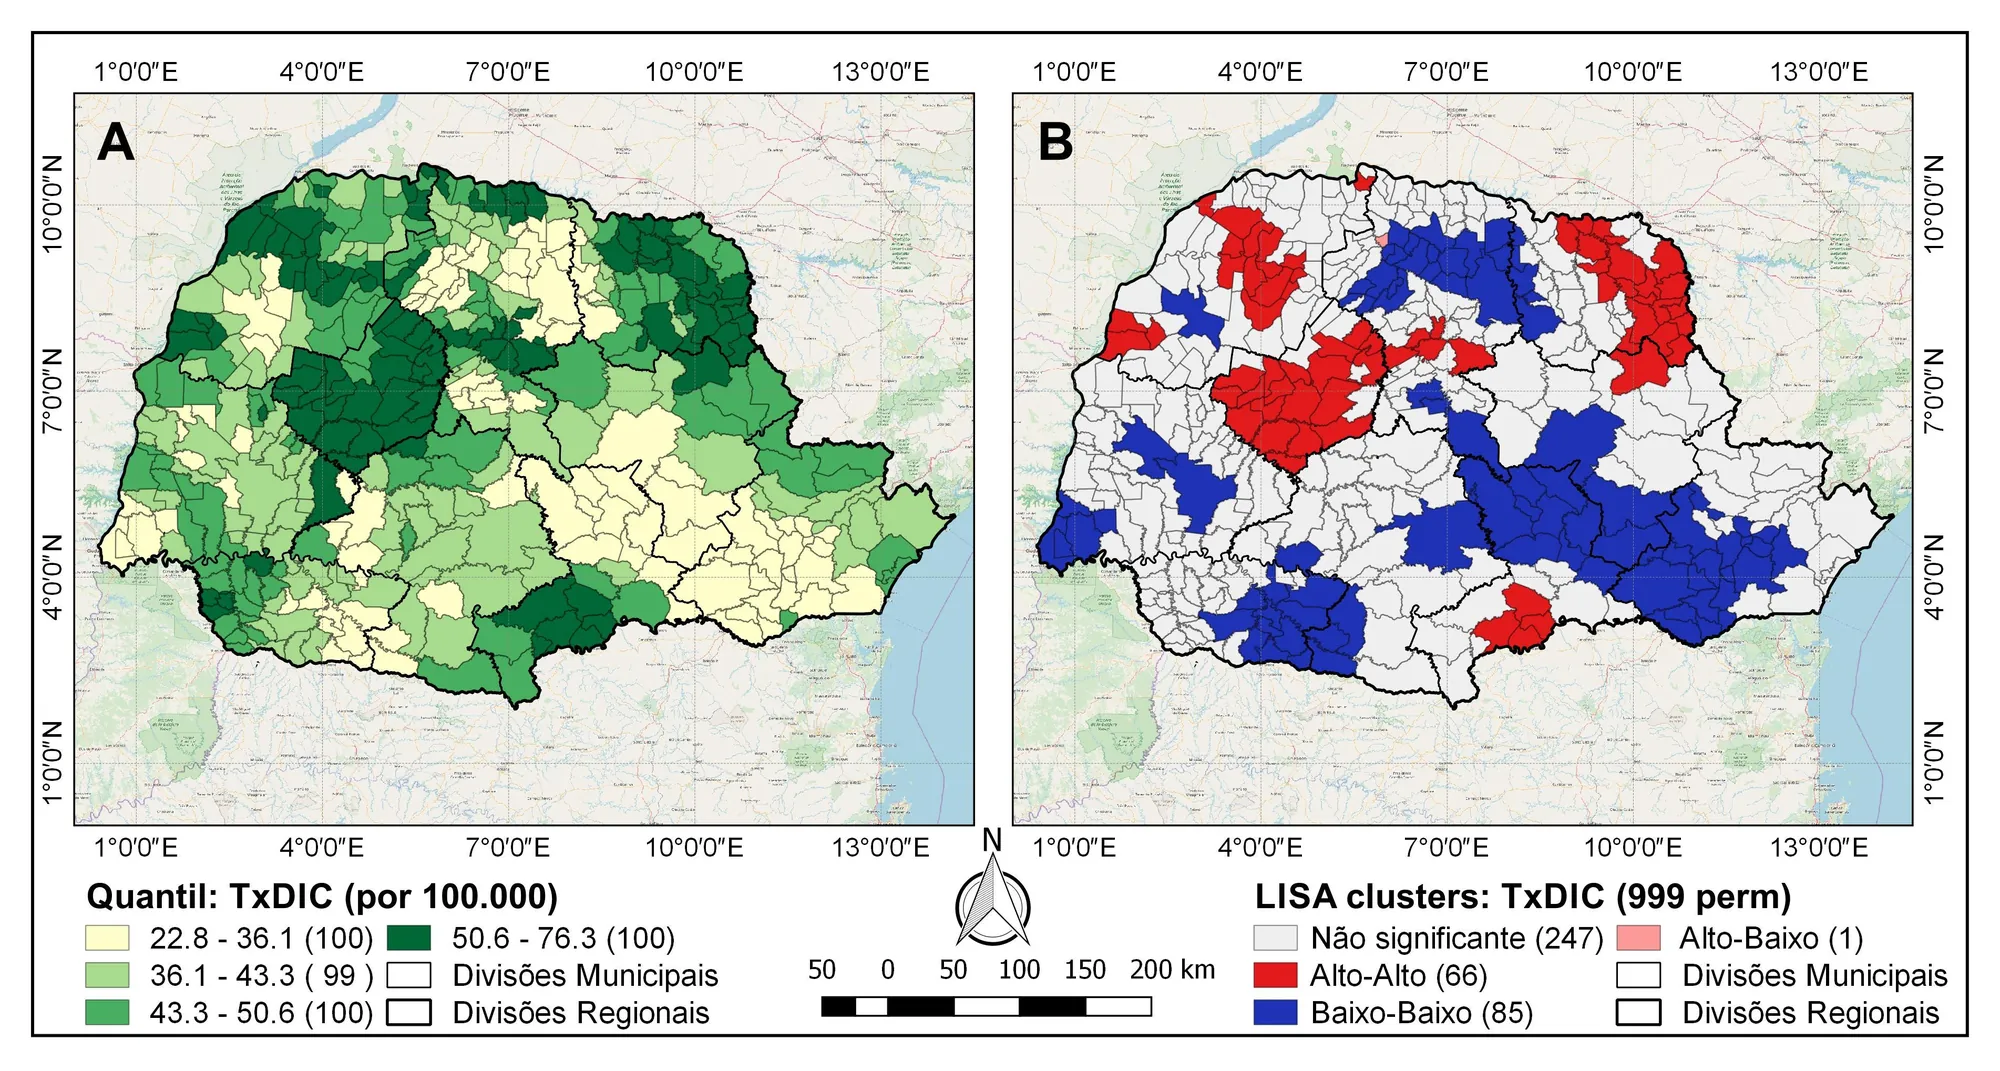
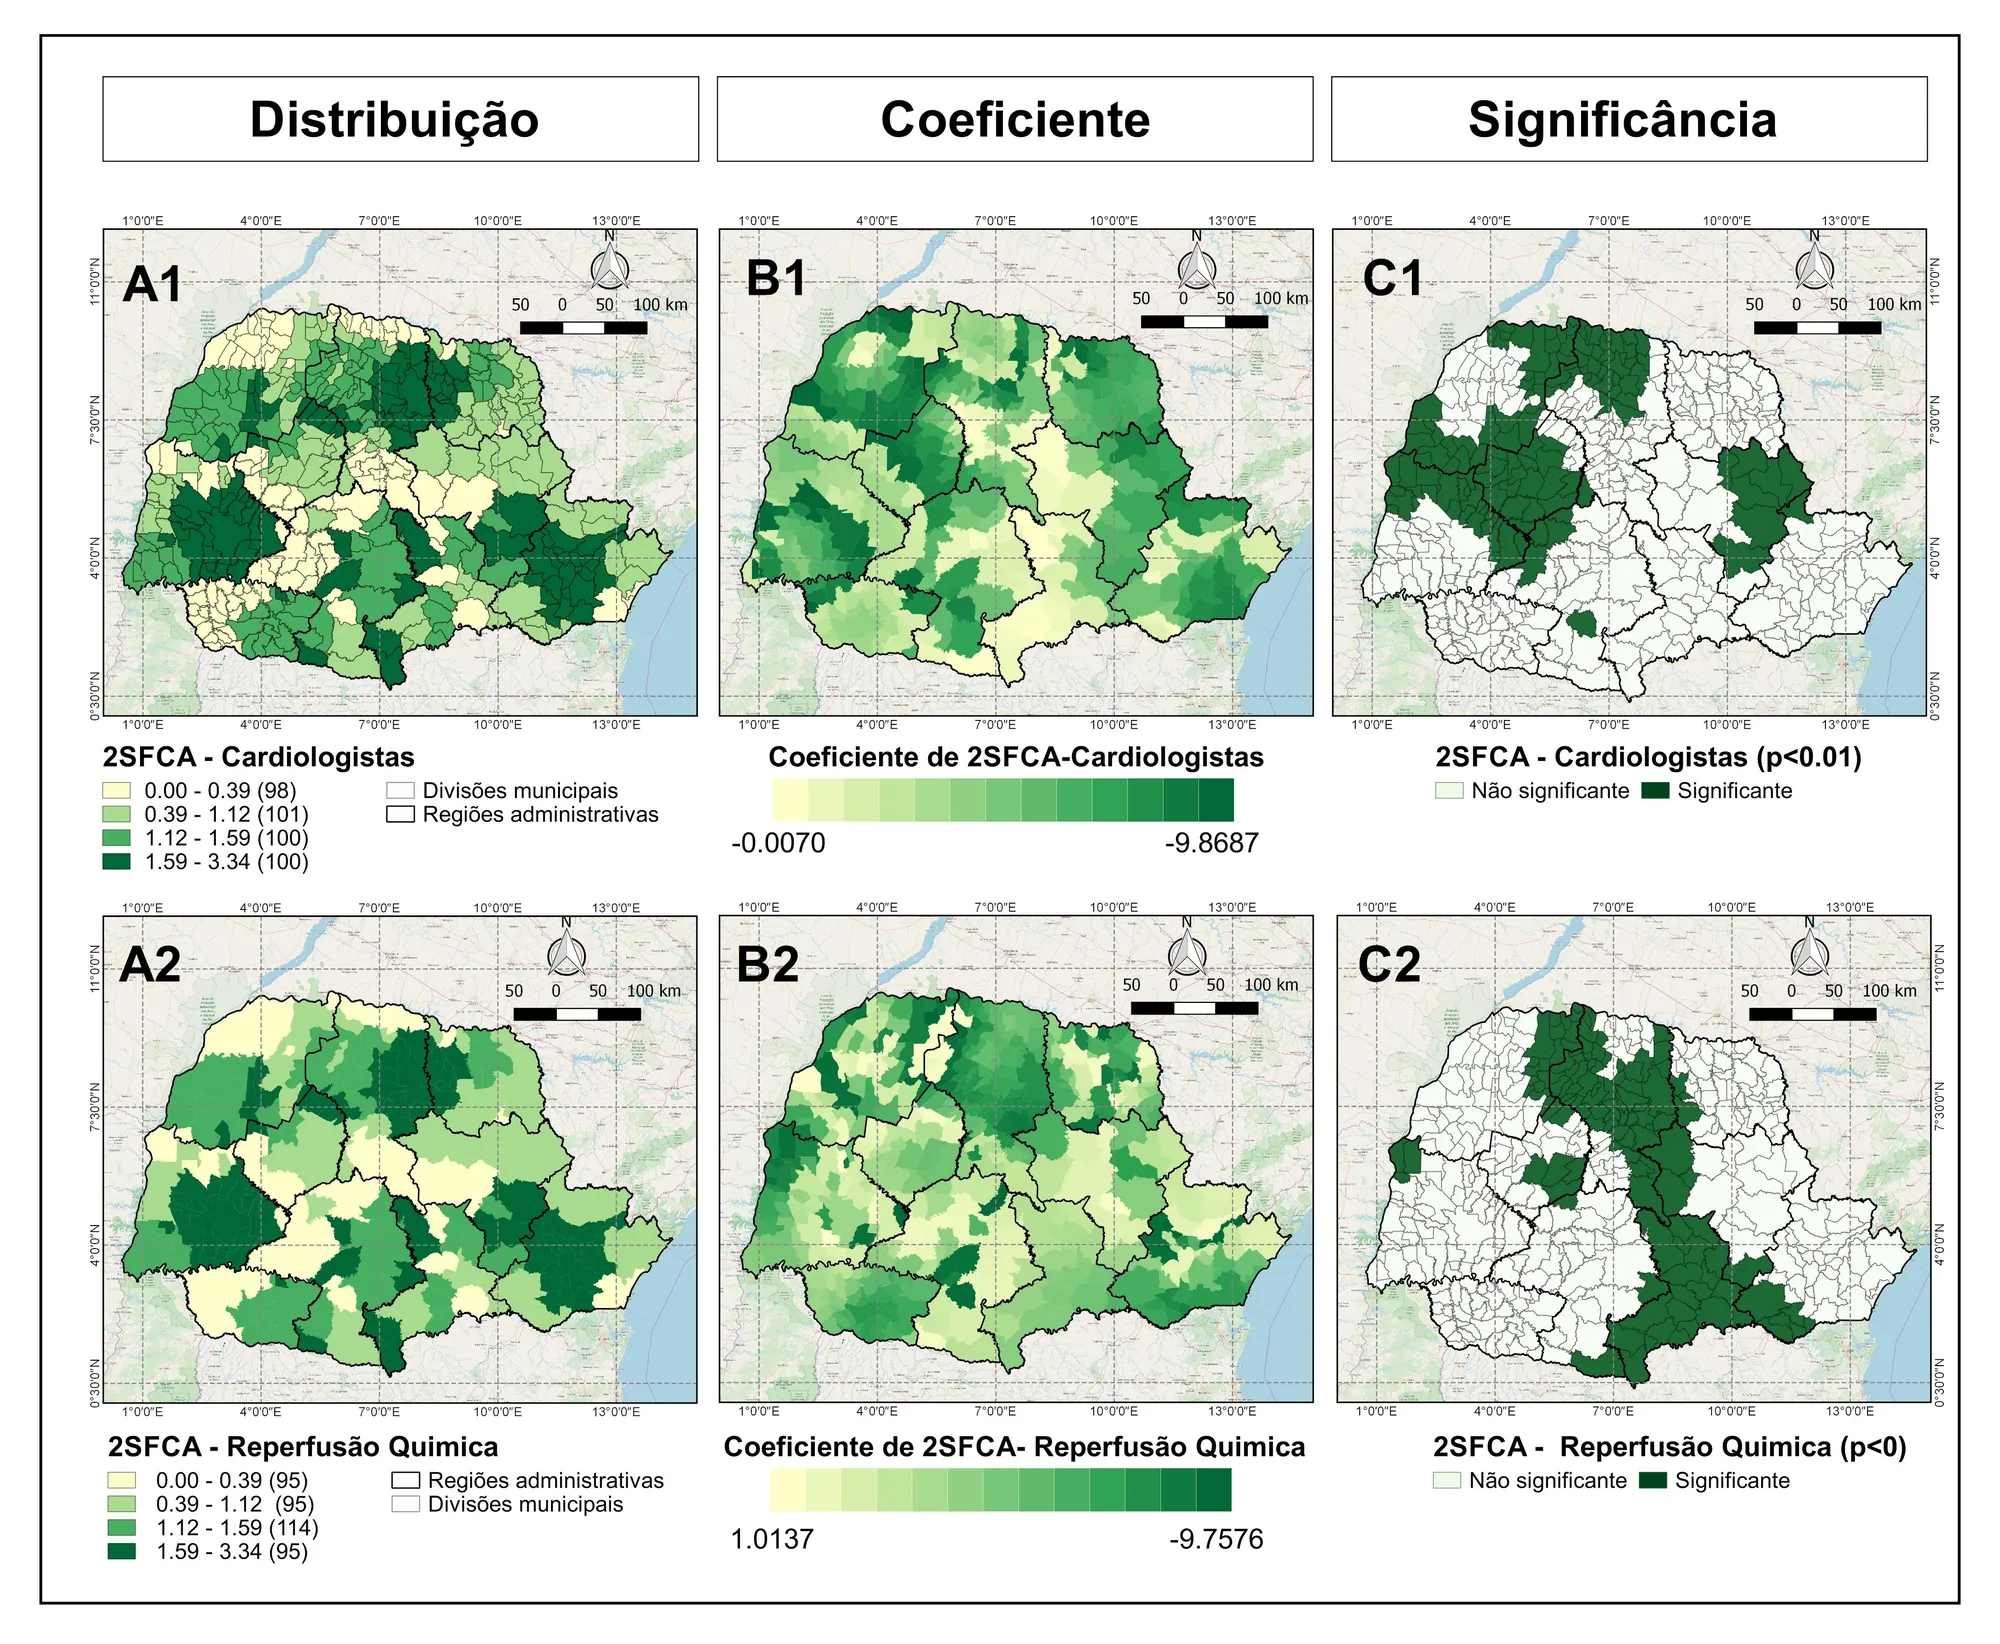
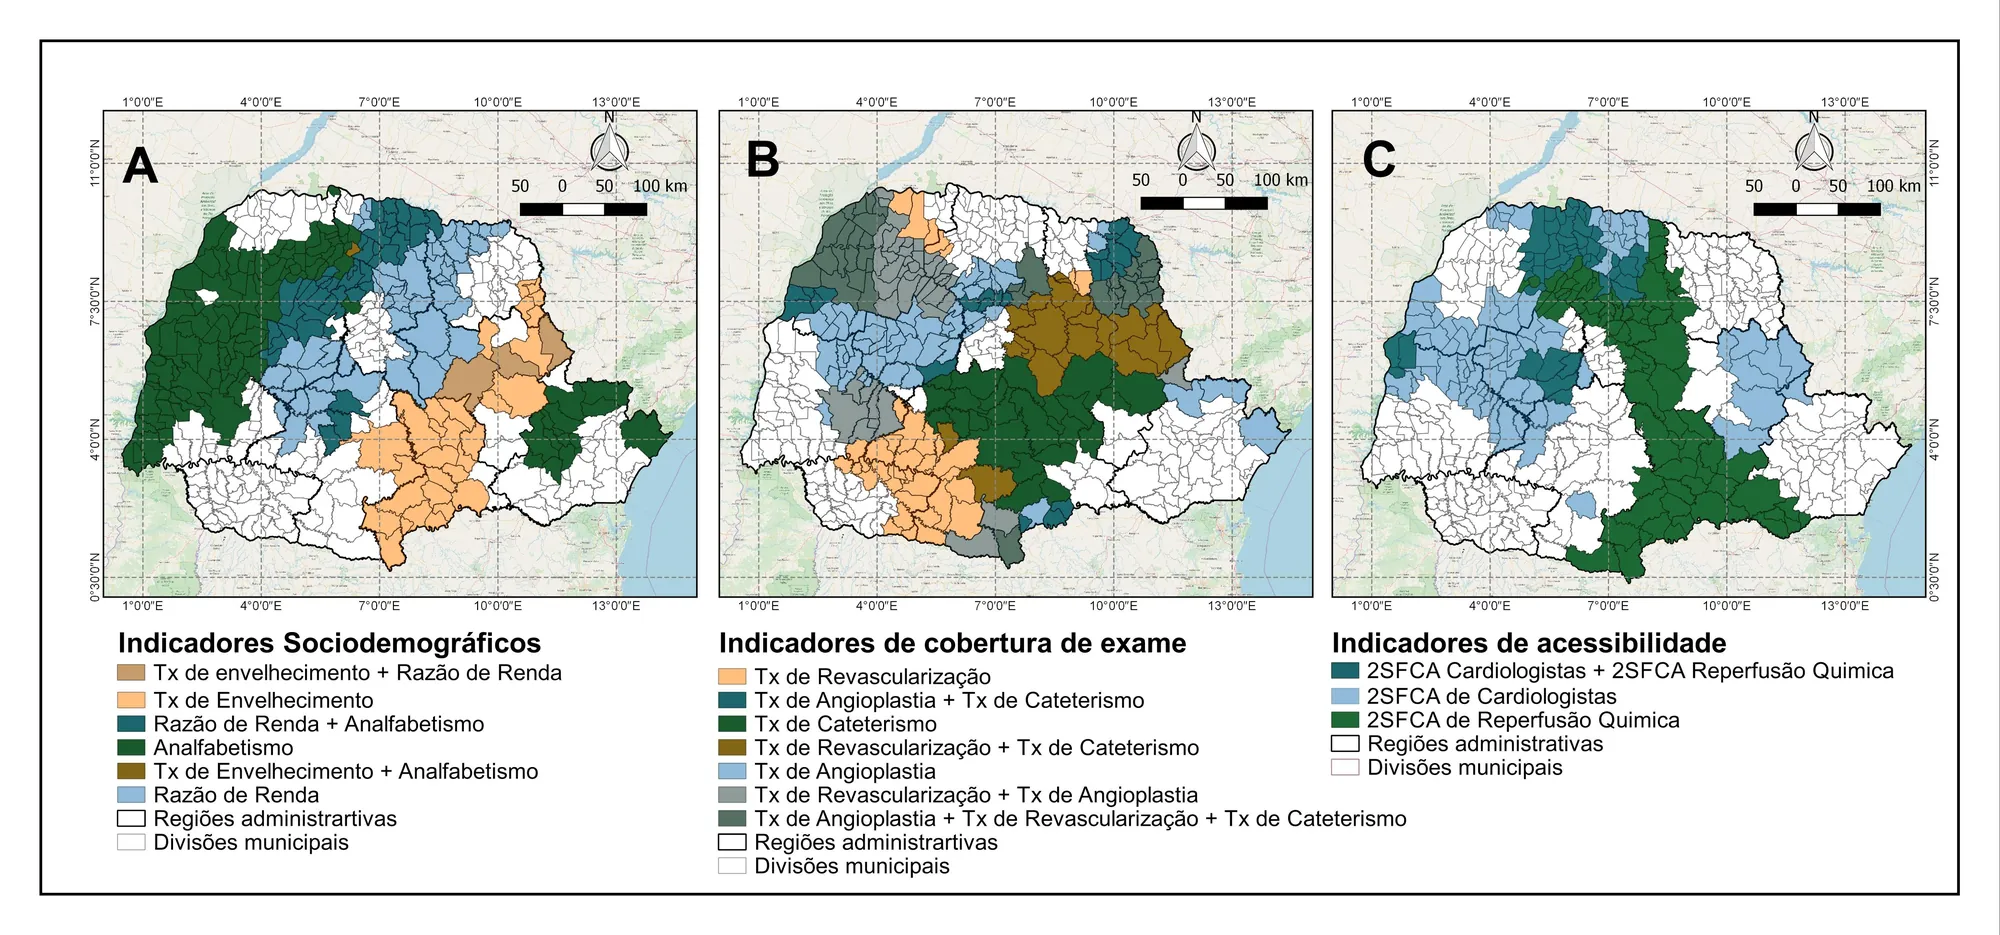
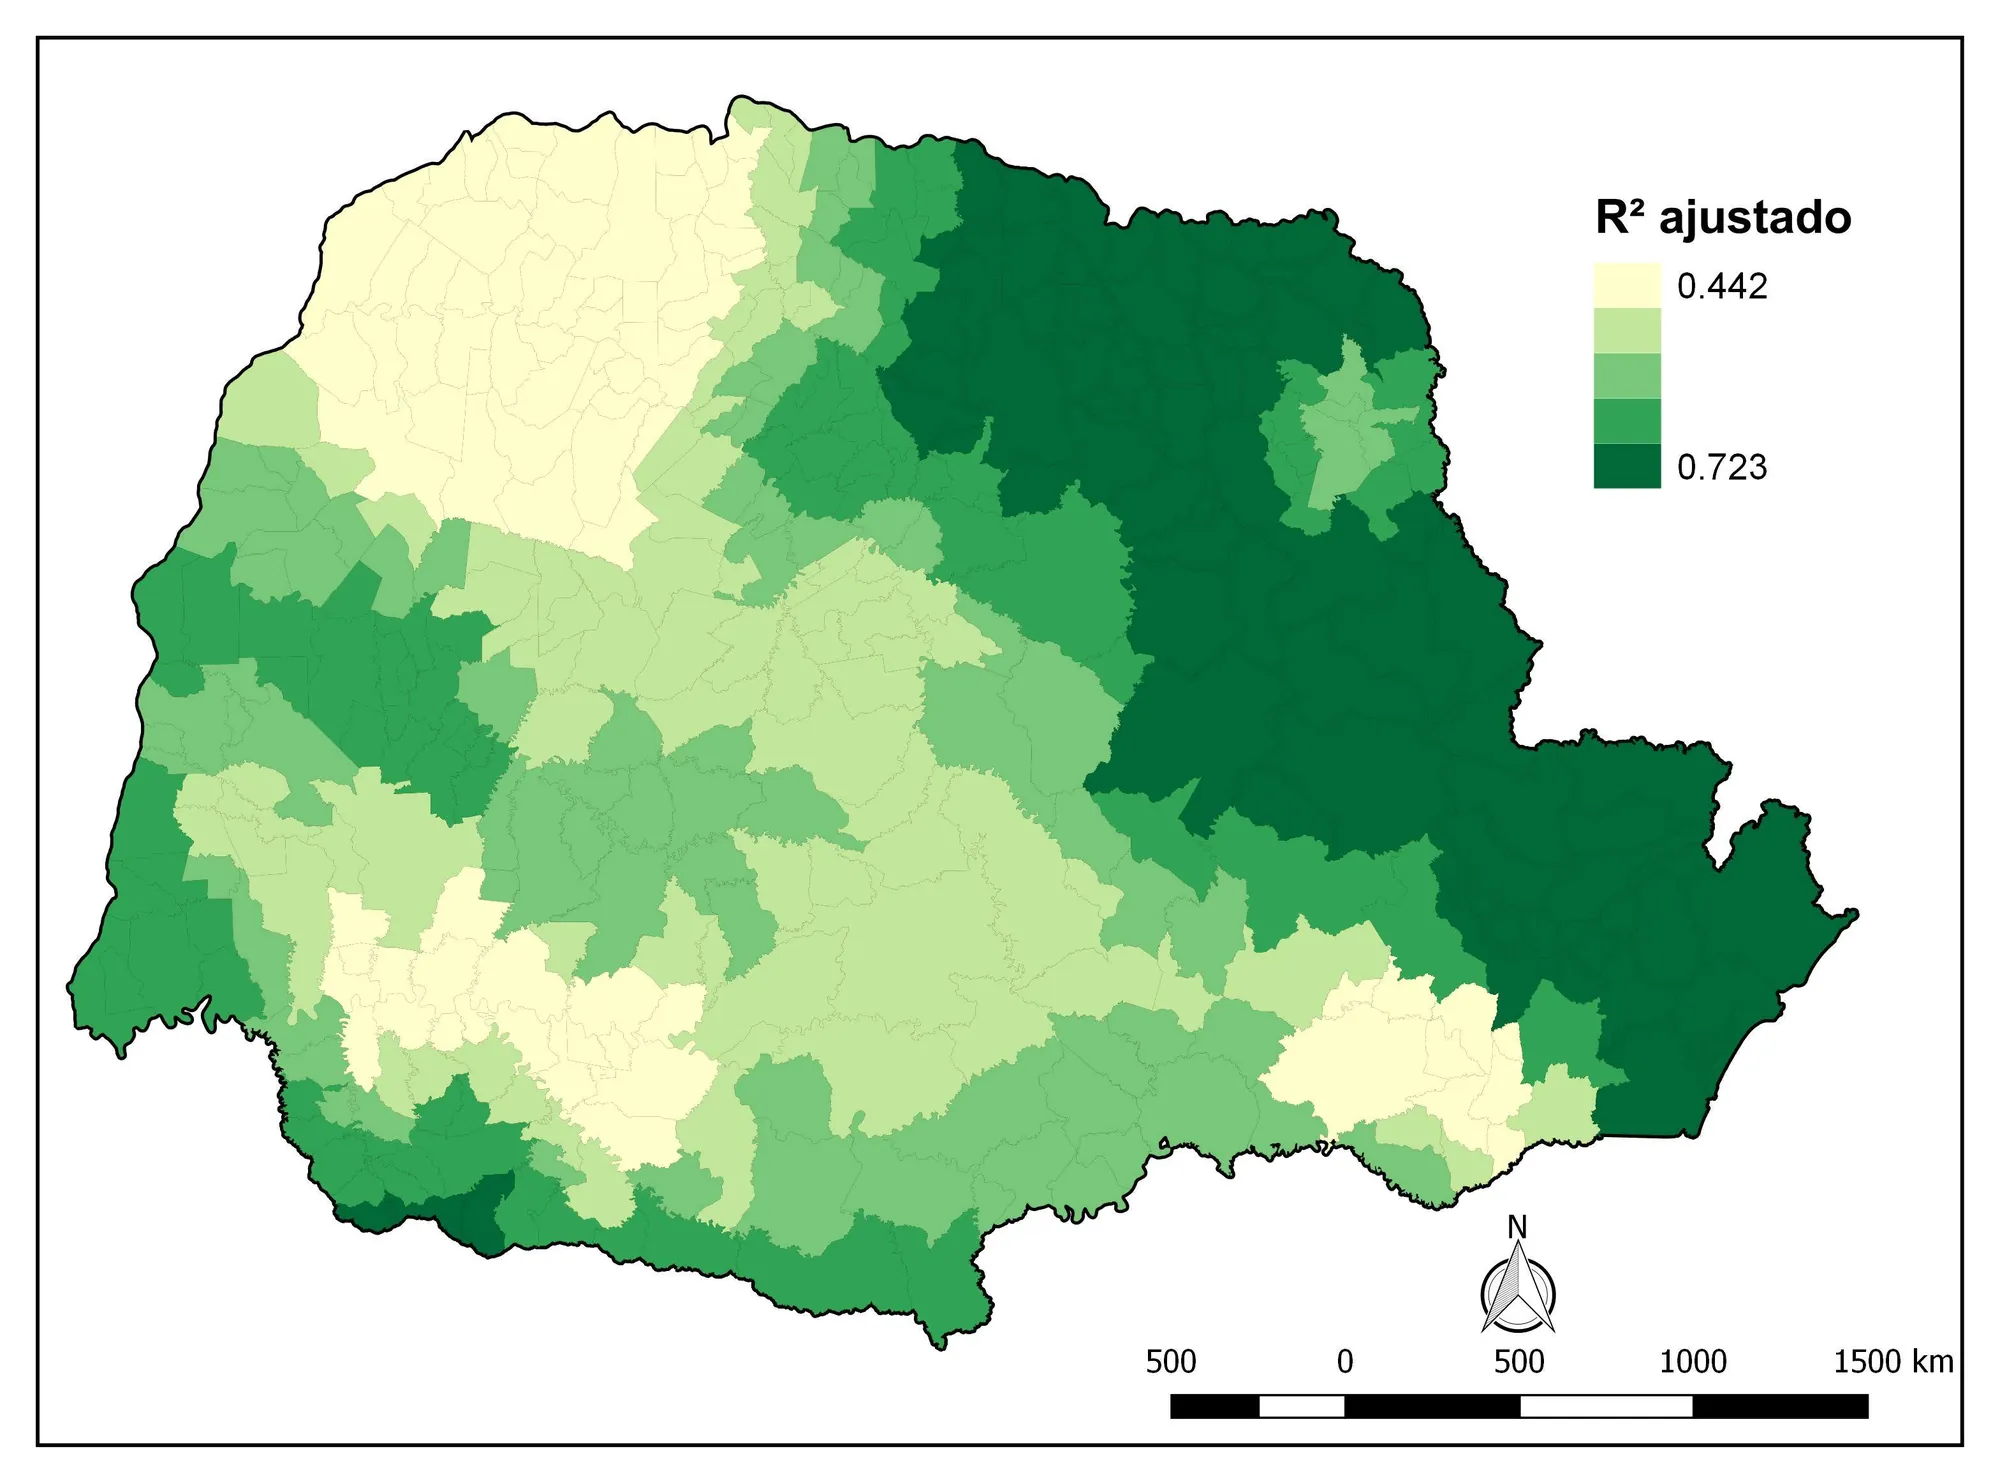
Figures supplied by the group from its own work. On their own they do not stand for a published result — see the publications for the full context.
Where each image comes from.
The archive handed over by the group holds 500 files — 469 images and 31 videos — between 14 June 2017 and 29 August 2025. Thirty-six pieces were published. Processing was limited to cropping, rotation and colour-cast correction. Nothing was recomposed, and nothing was computer-generated.
- Files received
- 500
- Images
- 469
- Videos
- 31
- Published here
- 36
- Period
- 14.06.2017 — 29.08.2025
What was left out, and why
- 01
Private life
Homes, kitchens, restaurants, bars and leisure trips. Not institutional material, and it exposes people outside the context of their work.
- 02
Identifiable children
They do not go on a public page without formal consent from those responsible for them.
- 03
Third-party material
Items with protected third-party artwork embedded. Republishing would be an improper use.
- 04
Information that did not check out
One outreach card carried an article title that does not match the identifier printed on it. Checked against the source and discarded.
- 05
Unreadable frames
Underexposed, blurred, or with no identifiable subject.