


GeoAI cardiovascular
A mortalidade cardiovascular se concentra em territórios específicos; prever onde o risco é maior orienta onde investir.
- Status
- Publicado
- Período
- 2018 – 2020
- Registro
- PLOS ONE 2020
- DOI
- 10.1371/journal.pone.0243558
Modelos de aprendizado de máquina (SVM, PCR, KNN, Random Forest) treinados com dados socioeconômicos e assistenciais dos 399 municípios do Paraná para mapear o risco de mortalidade por doença isquêmica do coração e gerar um índice municipal de risco (HHCI).

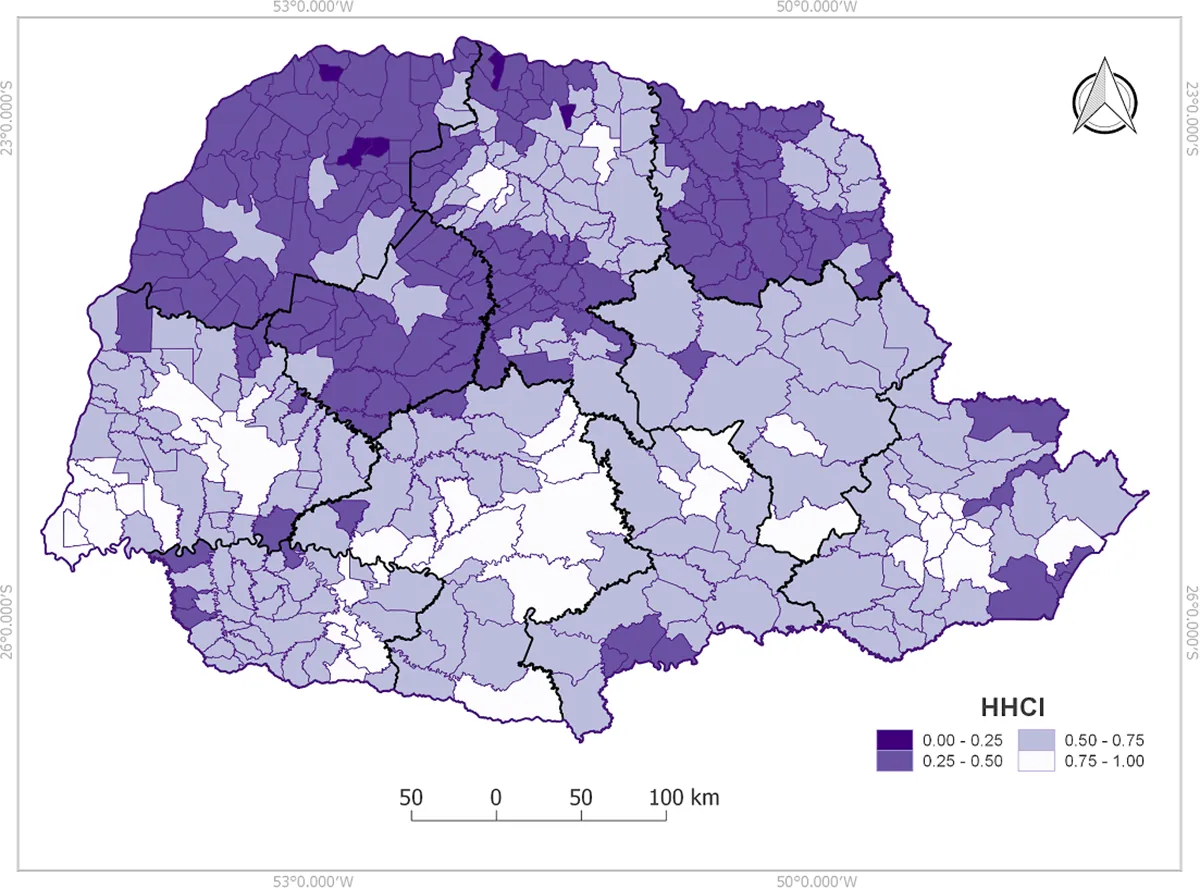
Distribution of the generated municipalities index. 1 lower risk and 0 higher risk.
Figura de Mapping risk of ischemic heart disease using machine learning in a Brazilian state — Marcela Bergamini et al. · PLOS ONE · 2020 · 10.1371/journal.pone.0243558 — CC BY 4.0
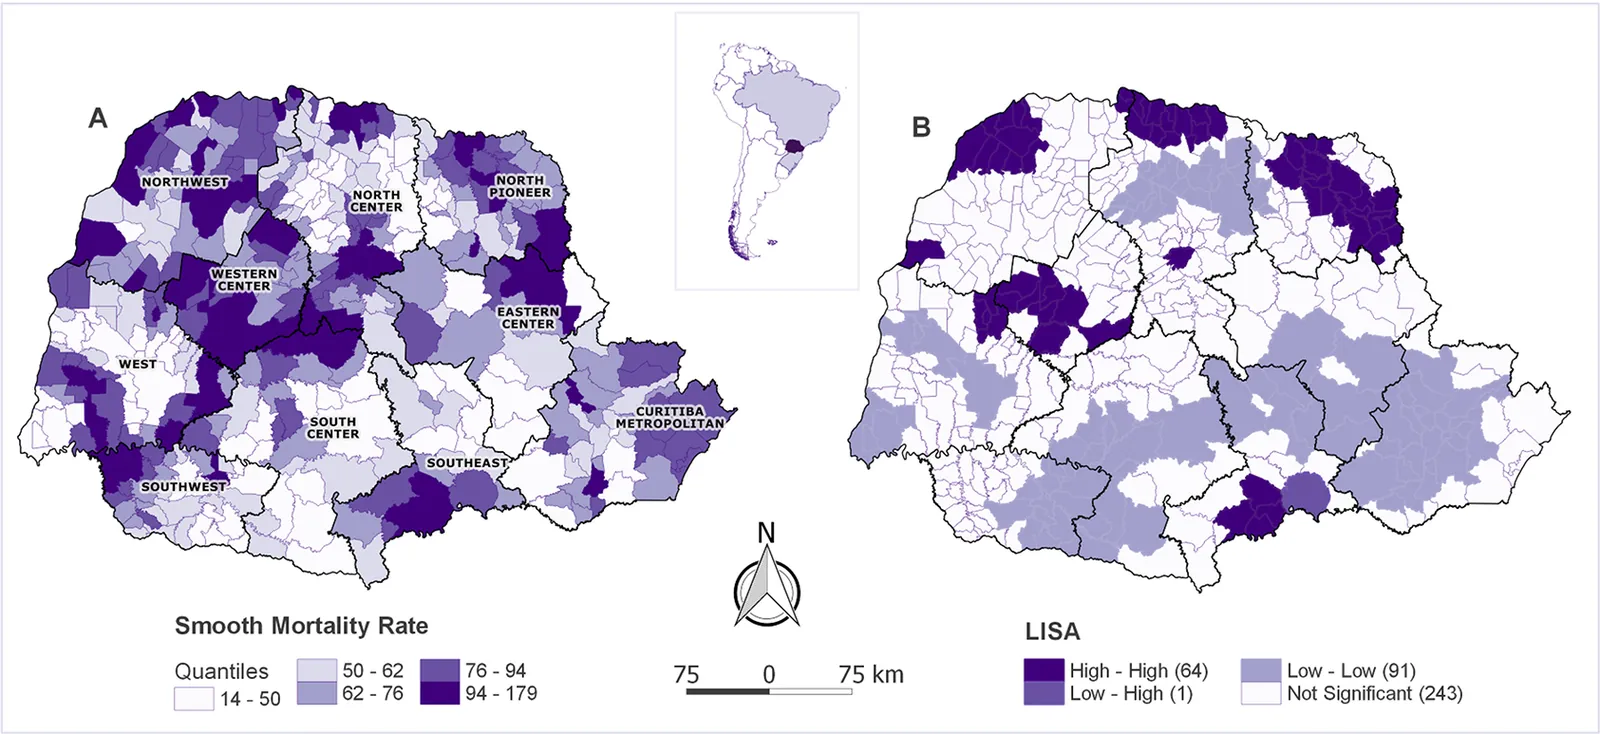
Spatial exploratory analysis of municipalities’ IHD mortality rates. A—Distribution of spatially IHD mortality rates observed in the state of Paraná from 2009–2015 in quantiles by municipality. B—Local Indicators of Spatial Association (LISA) of IHD mortality rates by municipality.
Figura de Mapping risk of ischemic heart disease using machine learning in a Brazilian state — Marcela Bergamini et al. · PLOS ONE · 2020 · 10.1371/journal.pone.0243558 — CC BY 4.0
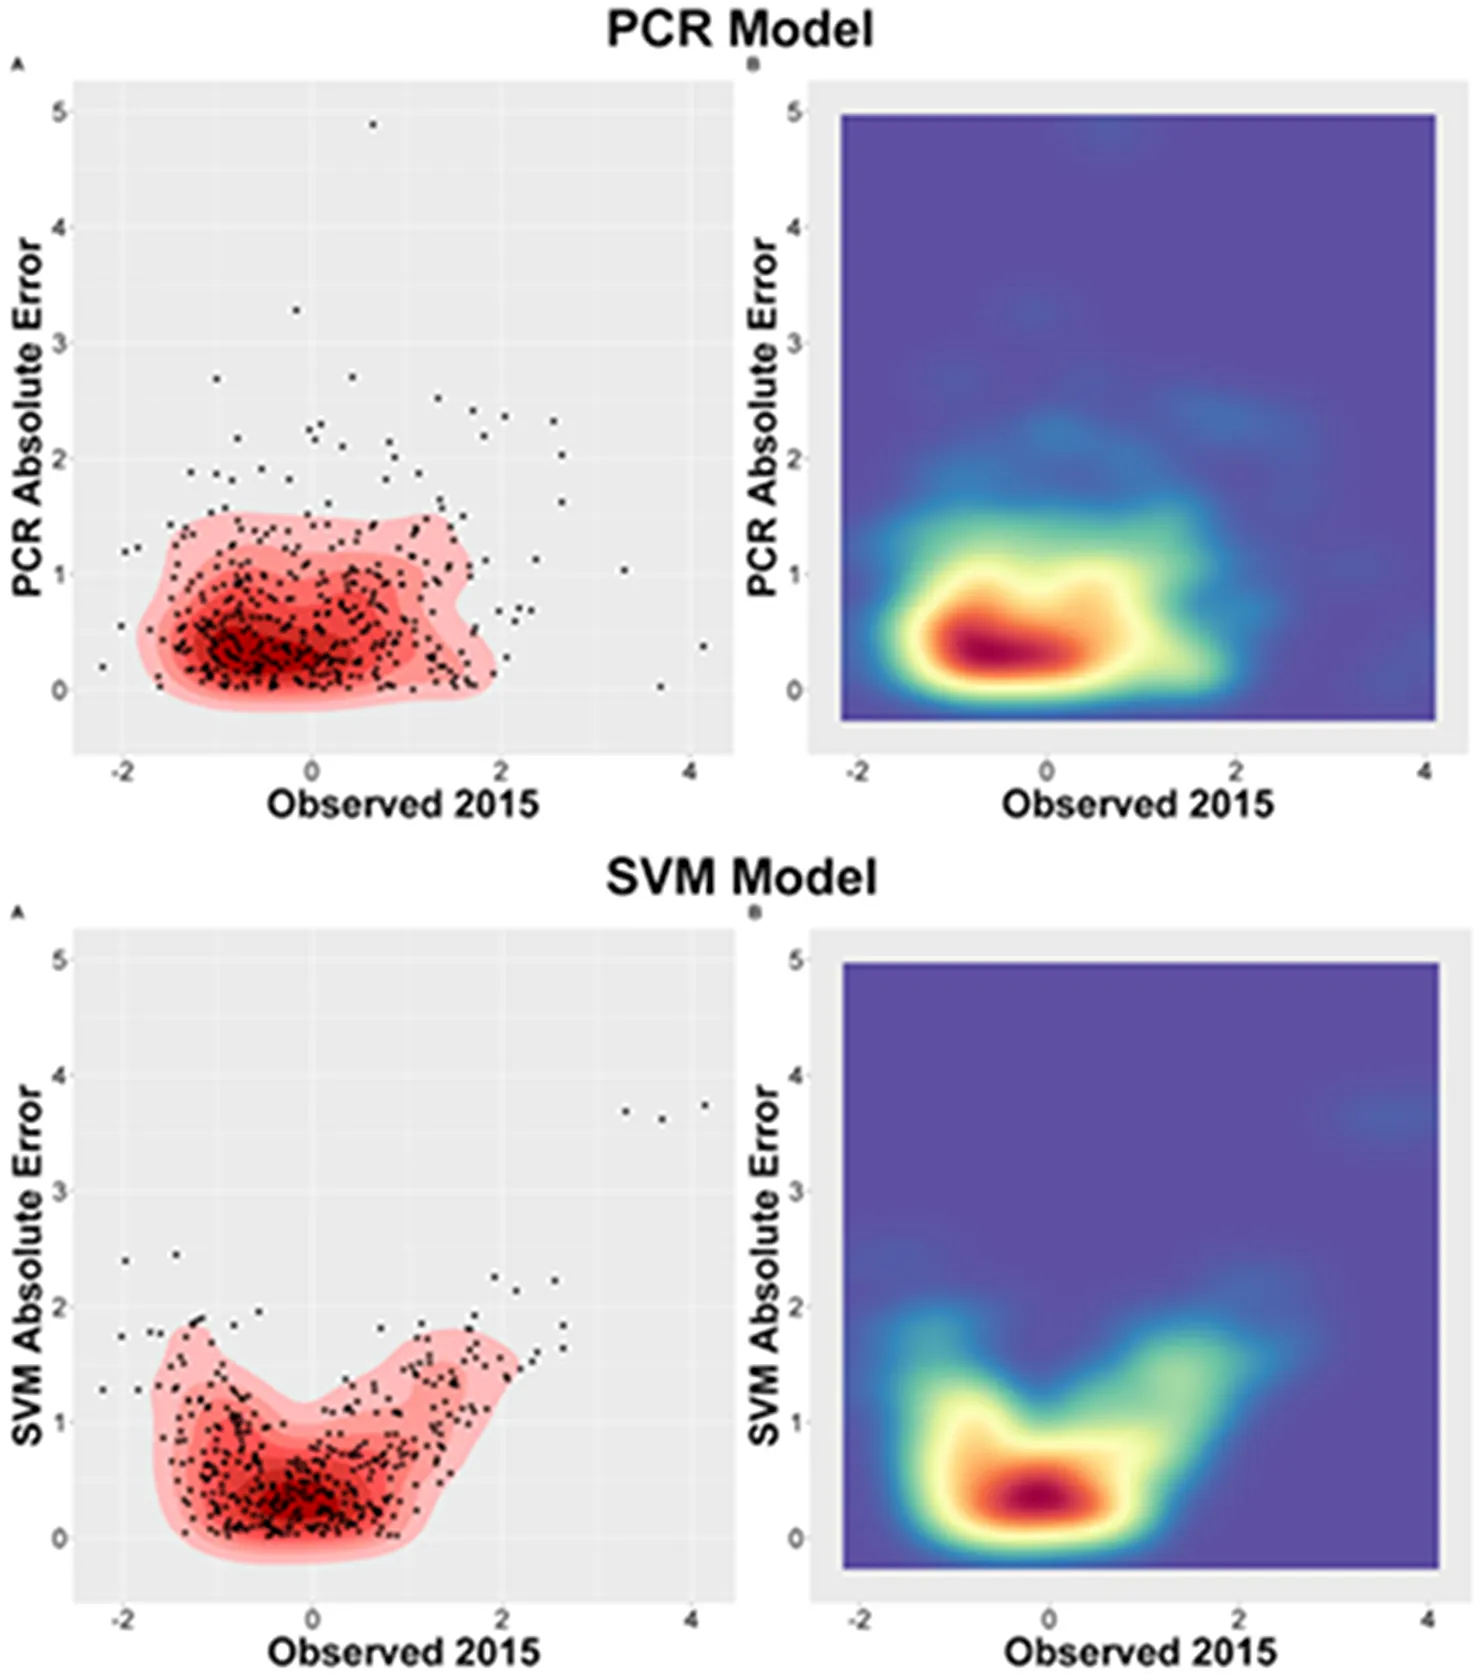
RMSE distribution representation. A—PCR model (2015) B—SVM model (2015).
Figura de Mapping risk of ischemic heart disease using machine learning in a Brazilian state — Marcela Bergamini et al. · PLOS ONE · 2020 · 10.1371/journal.pone.0243558 — CC BY 4.0
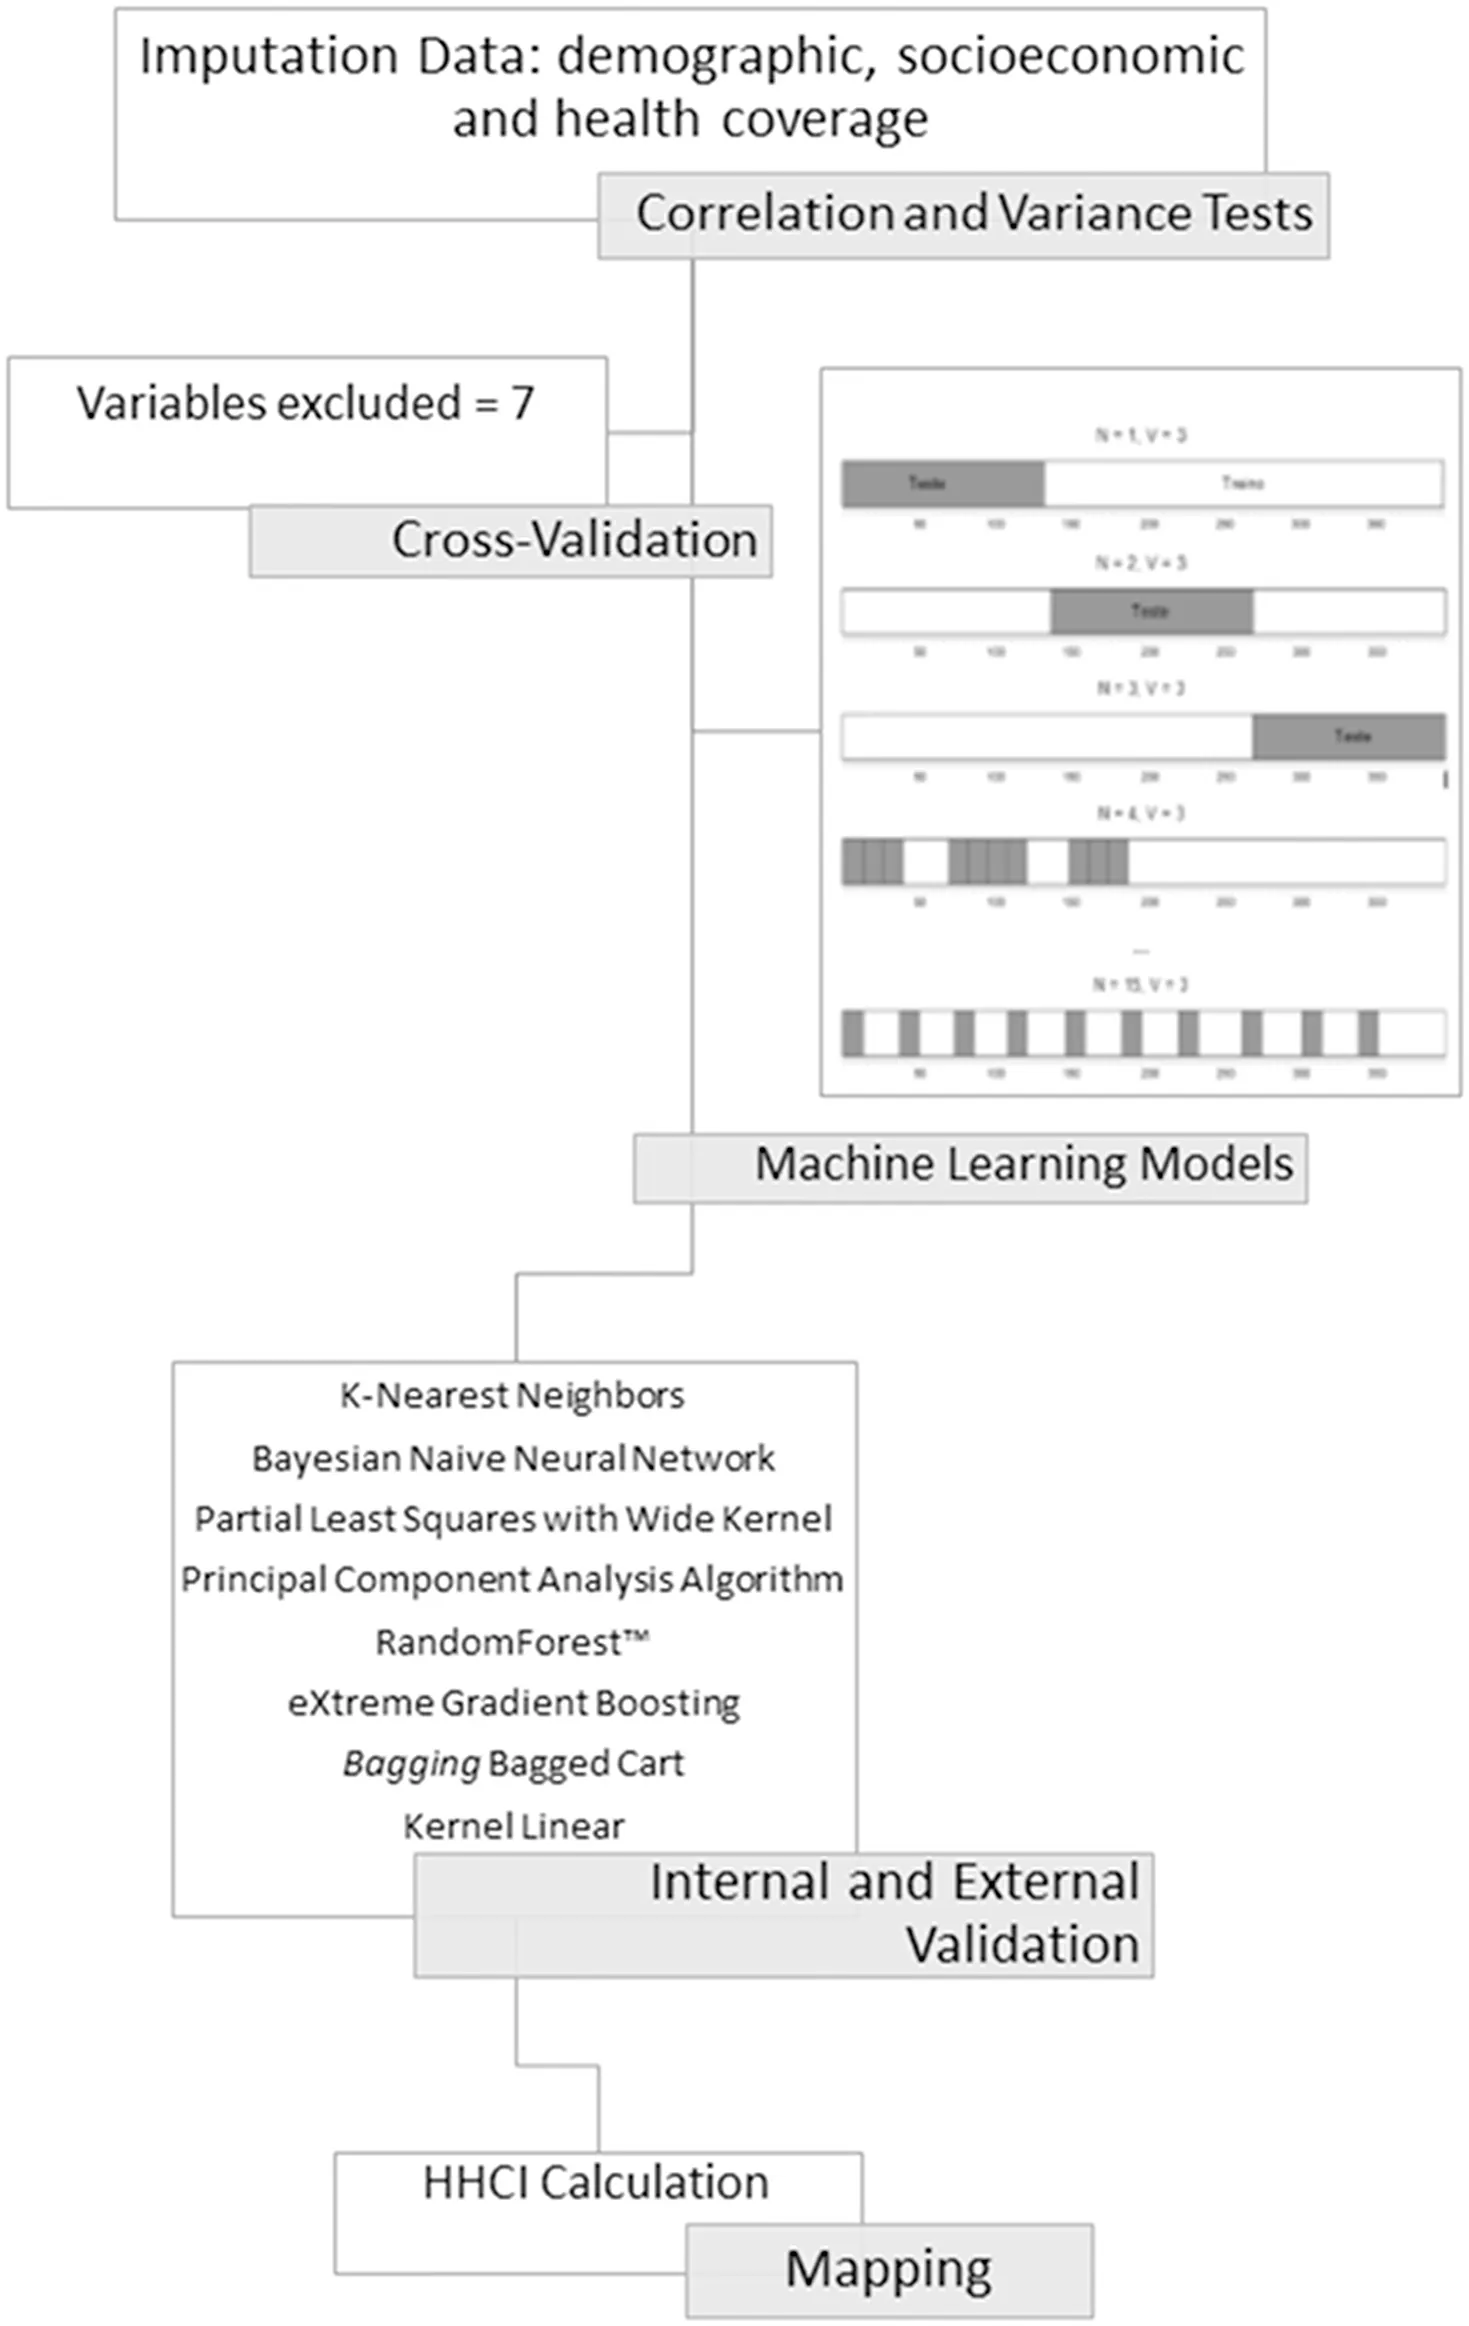
Representative flowchart of the main machine learning model development stages. 1) Variables pre-processing (correlation and variation tests); 2) Predictive variables cross-validation; 3) Machine learning models discrimination and validation (internal and external validation); 4) Heart Health Care Index (HHCI) calculation and mapping.
Figura de Mapping risk of ischemic heart disease using machine learning in a Brazilian state — Marcela Bergamini et al. · PLOS ONE · 2020 · 10.1371/journal.pone.0243558 — CC BY 4.0
- 2020Mapping risk of ischemic heart disease using machine learning in a Brazilian statePLOS ONE · 11 autores · 11 citações10.1371/journal.pone.0243558Abrir o artigo ↗
- 2023Applicability of machine learning technique in the screening of patients with mild traumatic brain injuryPLOS ONE · 12 autores · 10 citações10.1371/journal.pone.0290721Abrir o artigo ↗
- 2024Applicability of machine learning algorithm to predict the therapeutic intervention success in Brazilian smokersPLOS ONE · 15 autores · 1 citação10.1371/journal.pone.0295970Abrir o artigo ↗